More students graduating on time!

New Orleans 4-year Cohort Graduation Rate Continues to Rise

The citywide 4-year graduation rate for New Orleans (OPSB+RSD) increased by 2.5 percentage points, bringing it to 75.2% of all students graduating on time.
 
Today, the state released the 4-year cohort graduation rates for the Class of 2015. The Class of 2015 cohort includes all students who entered 9th grade for the first time in 2011, and the cohort graduation rate is the percentage of students in the cohort who graduated within four years. 

New Orleans Outperforms the State in Every Key Sub-Group

In 2015, 73.3% of African-American students graduated on time in New Orleans, an increase of 2.6 percentage points from 2014 and 1.9 points higher than the state average of 71.4% for African-American students. 
 
The New Orleans 4-year cohort graduation rates for other key sub-groups – students with disabilities, economically disadvantaged students, and English language learners – were also higher than the state average for these sub-groups.

Continue reading

High School Performance – A WOW Moment!

New Orleans high schools are (finally) showing great improvement.

The state released Letter Grades and School Performance Scores (SPS) for most high schools1, and there is cause for celebration!

Highlights

  • More than half of New Orleans high schools earned a letter grade of A or B. Five years ago, only two high schools had an A or B letter grades and both were selective admission schools (Ben Franklin and Lusher).
  • New Orleans schools outperform other high-poverty high schools in Louisiana. Among schools statewide serving student populations where three-quarters or more of students are economically disadvantaged, New Orleans has the top 5 performing schools.
School
2015 Grade
SPS
Edna Karr A 111.1
Warren Easton A 109.2
Sci High B 98.6
KIPP Renaissance B 96.8
Sci Academy B 96.3
  • Four high schools were among the top 10 most improved in the state: KIPP Renaissance, Clark Prep, New Orleans Military and Maritime Academy, and Sci Academy.
  • Eight high schools improved enough to change their letter grade.

Continue reading

By the Numbers: Student and School Performance

This fall, Louisiana’s Department of Education will release new baseline scores for schools and for student performance. As we move to the new academic standards, Educate Now! will no longer use 2005 as a comparison point. Instead, our new baseline will be the 2014-15 school year.

It’s time to focus on what’s next for New Orleans public schools, but before we move on, Educate Now! wants to thank the educators, administrators and volunteers who have worked tirelessly over the past decade to help our students succeed.

Ten years after Katrina, here’s how New Orleans public schools have changed.

SCHOOL AND STUDENT PERFORMANCE

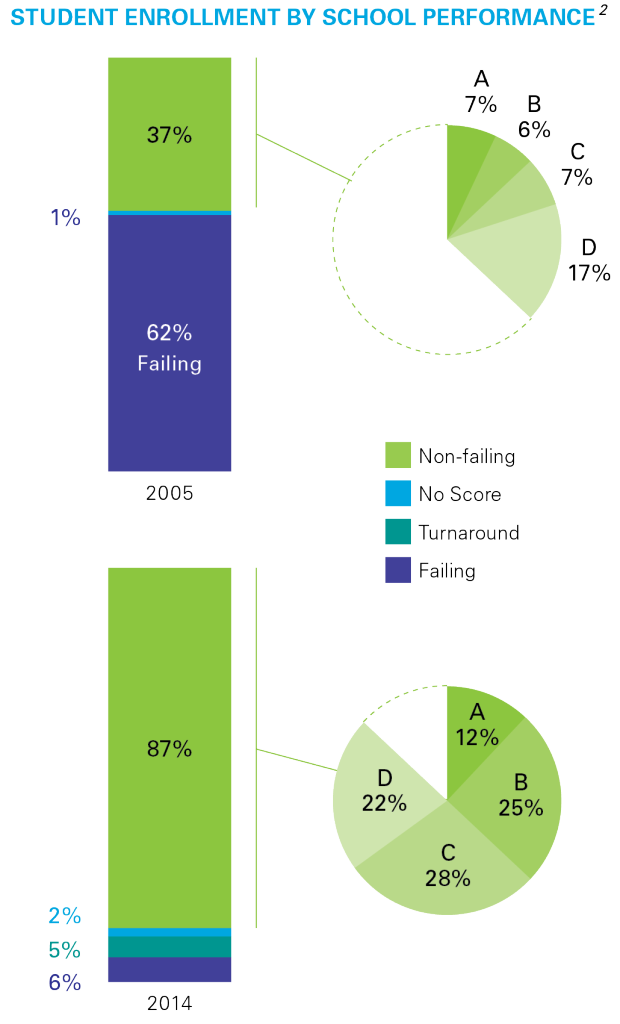
The percentage of students enrolled in failing schools fell from 62% to 6%. The percentage enrolled in A or B schools increased from 13% to 37%.1
en-enrollment-by-performance-072715
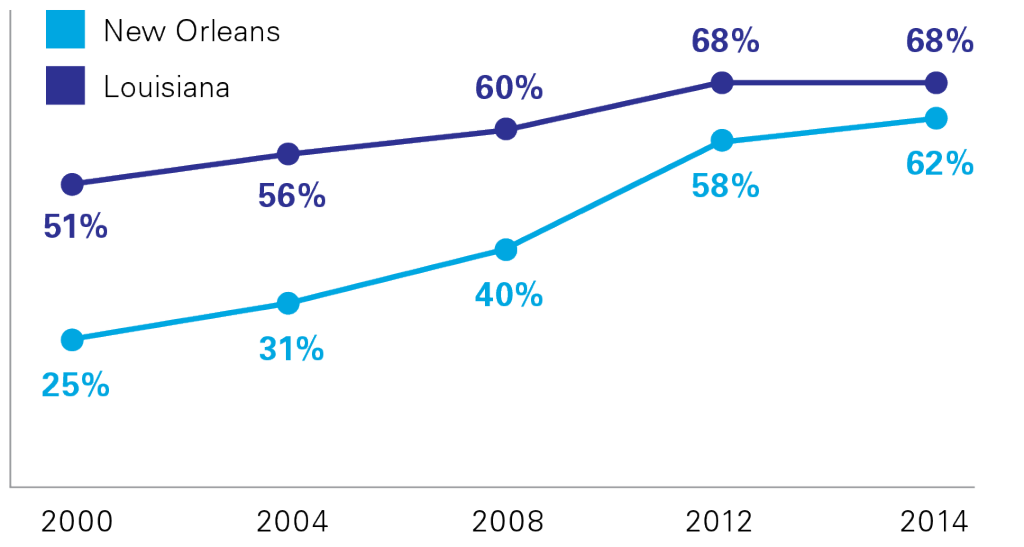
The percentage of students proficient on state tests increased from 25% to 62%.
aen-performance-all-students-072715 no header
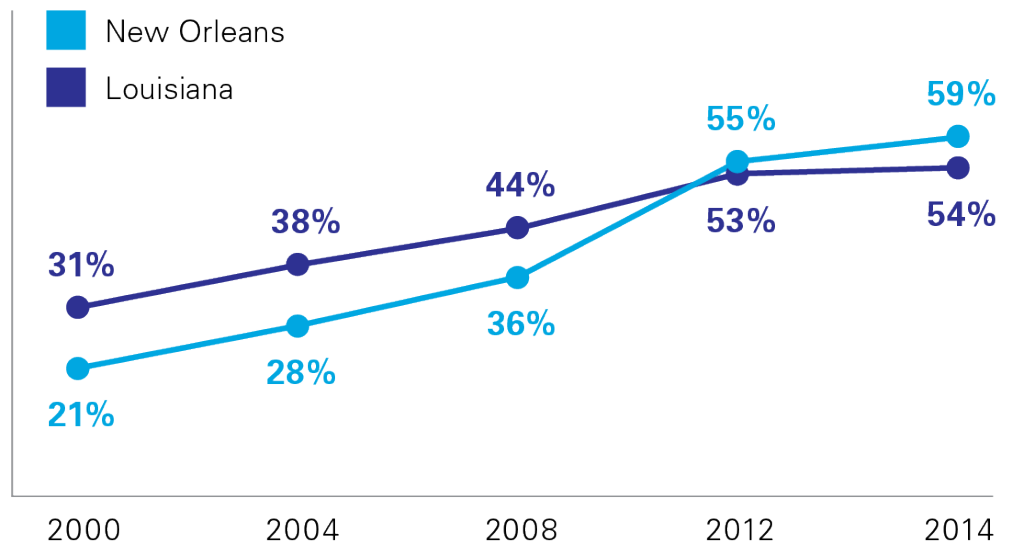
The percentage of Black students proficient on state tests increased from 21% to 59%, and we now outperform the state by 5 percentage points.
aperformance-black-students


Continue reading

N.O.’s Expulsion Rate Below State Average

New Orleans’ Expulsion Rate is Below the State Average

In 2014-15, the Student Hearing Office worked with schools, students, and advocates to refine expulsion policies for New Orleans. Discipline conferences are now used as an intervention prior to expulsion and are keeping more students in school. Additionally, student offenses are tiered based on severity of behavior to better differentiate consequences.

The Results:

  • The number of expulsions fell from 231 to 199, even as student enrollment across the city increased.
  • The expulsion rate dropped from 0.52% to 0.43%.
  • New Orleans’ expulsion rate is now below the 2014 state average.
 
Expulsion Rate*
New Orleans
0.43%
State
0.50%


*State data is from 2013-14 year. The state has not completed its full 2014-15 data entry and verification.

Expulsion Rates by District

District 2014-2015 2013-2014 Change
# Students # Expelled Rate # Students # Expelled Rate Change in # Change in Rate
RSD
30,487 145 0.48% 30,220 198 0.66% – 53 – 27%
OPSB
13,335 47 0.35% 12,514 29 0.23% + 18 + 52%
OPSB Charter
10,008 17 0.17% 9,466 4 0.04% + 13 + 302%
OPSB Direct Run
3,327 30 0.90% 3,048 25 0.82% + 5 + 10%
BESE 1,981 7 0.35% 1,572 4
TOTAL
45,803 199 0.43% 44,306 231 0.52% – 32 – 17%

Continue reading

2015 ACT Scores: New Orleans Improves More than State

ACT Scores Continue to Rise

Highlights

New Orleans improved more than the state.

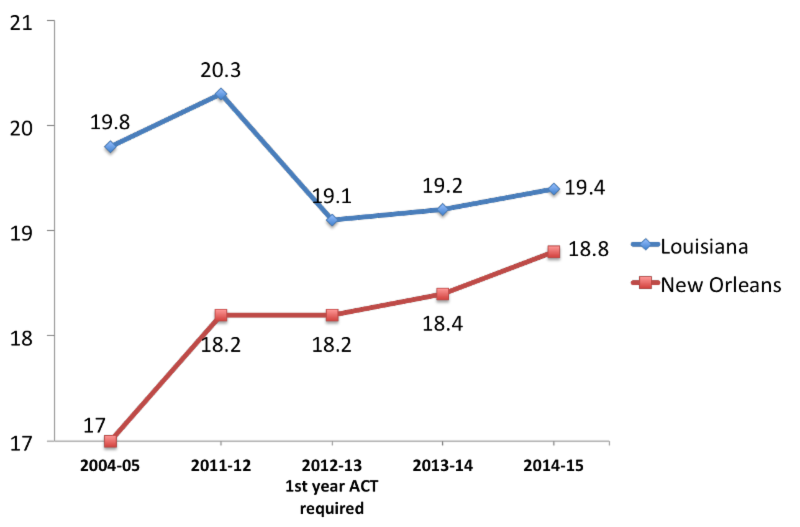
  • New Orleans’ composite ACT score improved from 18.4 to 18.8, a gain of 0.4 points, while the state improved from 19.2 to 19.4, a gain of 0.2 points.

More New Orleans students have TOPS-qualifying ACT scores.

  • 63% of the senior class scored a 17 or higher on the ACT (the qualifying score for 2-year TOPS Tech).
  • 38% of seniors scored a 20 or higher (the qualifying score for 4-year TOPS Opportunity).
New Orleans continues to move up in the state rankings.
 jkjk
Year ACT
Composite
Rank
2004-05 17 61 out of 68 parishes
2013-14 18.4 40 out of 69 parishes
2014-15 18.8 35 out of 69 parishes

New Orleans is closing the gap with the state’s ACT average.

ACT - Closing the Gap

Both OPSB and RSD improved.

  • OPSB gained 0.4 points, moving from 20.5 to 20.9.
  • RSD gained 0.2 points, moving from 16.4 to 16.6.
 

Continue reading

By the Numbers: The Graduating Class of 2014

The state just released new data on cohort graduation rates and college enrollment rates. Continuing our By the Numbers series, Educate Now! takes a look at the class of 2014.

THE GOOD NEWS

100% more students enrolled in college

In 2005, only 675 Orleans Parish Public School graduates enrolled in a two or four year college the following fall, compared to 1,360 graduates from New Orleans’ class of 2014.

Even though the 2014 senior class was much smaller than the 2005 senior class (2,654 students versus 3,753), our schools sent a much higher proportion of students to college. This tremendous increase is a testament to the hard work of educators in New Orleans.
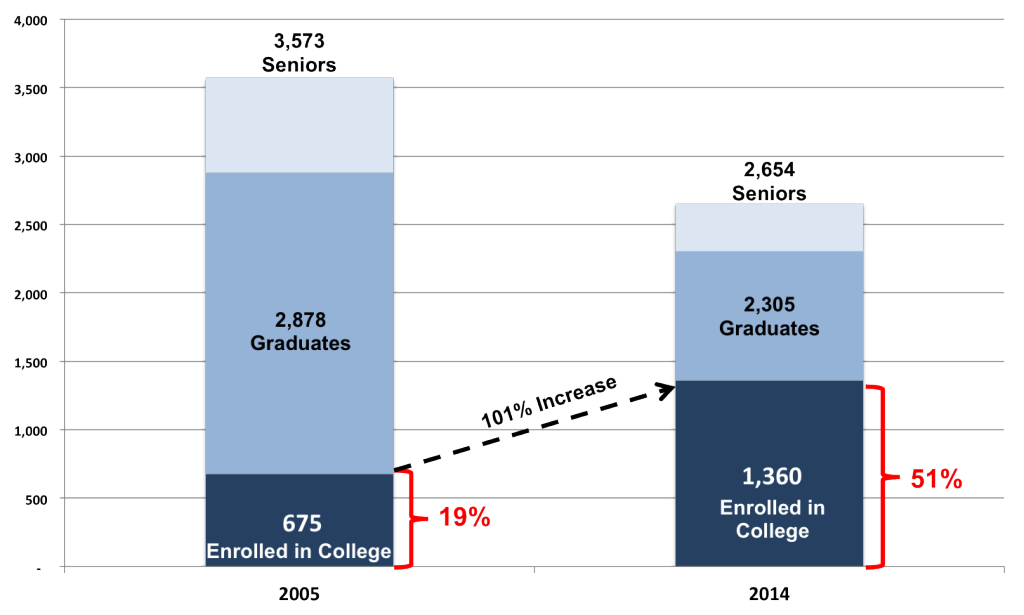
College_Enrollment_2005_vs_2014

 2005 vs. 2014

2005 2014
Number of seniors
3573 2654
Number of graduates
2878 2305
Number enrolled in college
675 1360
Percent of senior class in college
19% 51%

65% of Black males graduated on time: New Orleans outperforms nation

With a 65% Black male graduation rate1, New Orleans is now outperforming the state and the nation. The Schott Foundation recently published Black Lives Matter: The Schott 50 State Report on Public Education and Black Males. In 2013:
  • The national graduation rate for Black males was 59%.
  • Louisiana’s graduation rate for Black males was 59%.
  • New Orleans graduation rate for Black males was 65%.

Continue reading

By the Numbers: High School Performance 2005 vs. 2014

p The state just released the 2014 ACT scores for public schools. Continuing our By the Numbers series, Educate Now! takes a look at high school performance.

ACT Performance

New Orleans has seen strong gains since 2005.

The growth in ACT scores comes even as the percentage of seniors taking the test has increased significantly. (The state now requires students to take the ACT as part of high school accountability; in 2005, students were not required to take the ACT.) Since 2005, as the percentage of seniors taking the ACT increased, New Orleans improved its composite score1 from 17 to 18.4, while the state declined from 19.8 to 19.2. Both RSD and OPSB have seen gains in their ACT scores2.

  • During this time (2005 to 2014), the RSD improved its ACT average by 2 points, more than any other district in the state. It is one of only 5 districts that improved more than 1 point during this time.
  • OPSB improved by 0.8 points.
ACT Scores Over Time
  Class of 2005 Class of 2014 Change
OPSB
19.7 20.5 0.8
Schools transferred to RSD
14.4 16.4 2
New Orleans (OPSB + RSD)
17 18.4 1.4
Louisiana
19.8 19.2 – 0.6


If comparing performance, RSD schools serve a very different population than OPSB, with more African American students, more poor students, and more students with special needs. Some OPSB high schools have selective admissions, and only three of seven OPSB high schools participate in EnrollNOLA (OneApp). RSD data includes the alternative high schools in the city, and every RSD high school is open-admissions and participates in EnrollNOLA.

Continue reading

New Orleans by the Numbers: Public School Enrollment

Educate Now! looks at the public school student enrollment over the past ten years – from October 1, 2004 (the last data before Katrina) to this school year.

The Highlights

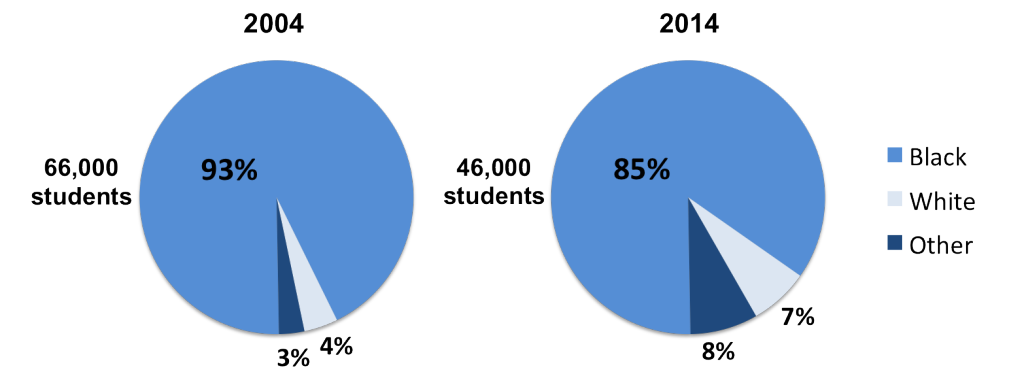
Schools are serving a more ethnically diverse student population.

Enrollment Citywide
Enrollment_demographics_04_vs_14


A higher percentage of students are economically disadvantaged*.
 

Economically_Disadvantaged_04_vs_14

Continue reading