High School Performance – A WOW Moment!

New Orleans high schools are (finally) showing great improvement.

The state released Letter Grades and School Performance Scores (SPS) for most high schools1, and there is cause for celebration!

Highlights

  • More than half of New Orleans high schools earned a letter grade of A or B. Five years ago, only two high schools had an A or B letter grades and both were selective admission schools (Ben Franklin and Lusher).
  • New Orleans schools outperform other high-poverty high schools in Louisiana. Among schools statewide serving student populations where three-quarters or more of students are economically disadvantaged, New Orleans has the top 5 performing schools.
School
2015 Grade
SPS
Edna Karr A 111.1
Warren Easton A 109.2
Sci High B 98.6
KIPP Renaissance B 96.8
Sci Academy B 96.3
  • Four high schools were among the top 10 most improved in the state: KIPP Renaissance, Clark Prep, New Orleans Military and Maritime Academy, and Sci Academy.
  • Eight high schools improved enough to change their letter grade.

Continue reading

PARCC Results: A New Baseline

The state has released the 2014-15 PARCC test results for English and math, grades 3-8.

How did New Orleans do?

  • 60% of students scored Proficient (Basic or above); the state was 65%.
  • 28% of students scored Mastery or above; the state was 33%.

Compared to other districts?

  • New Orleans is ranked 45th out of 69 districts for percent Mastery or above.
  • We outperformed 21 districts, and tied with three others.
  • We held steady. Last year we ranked 46th; this year we ranked 45th.

Continue reading

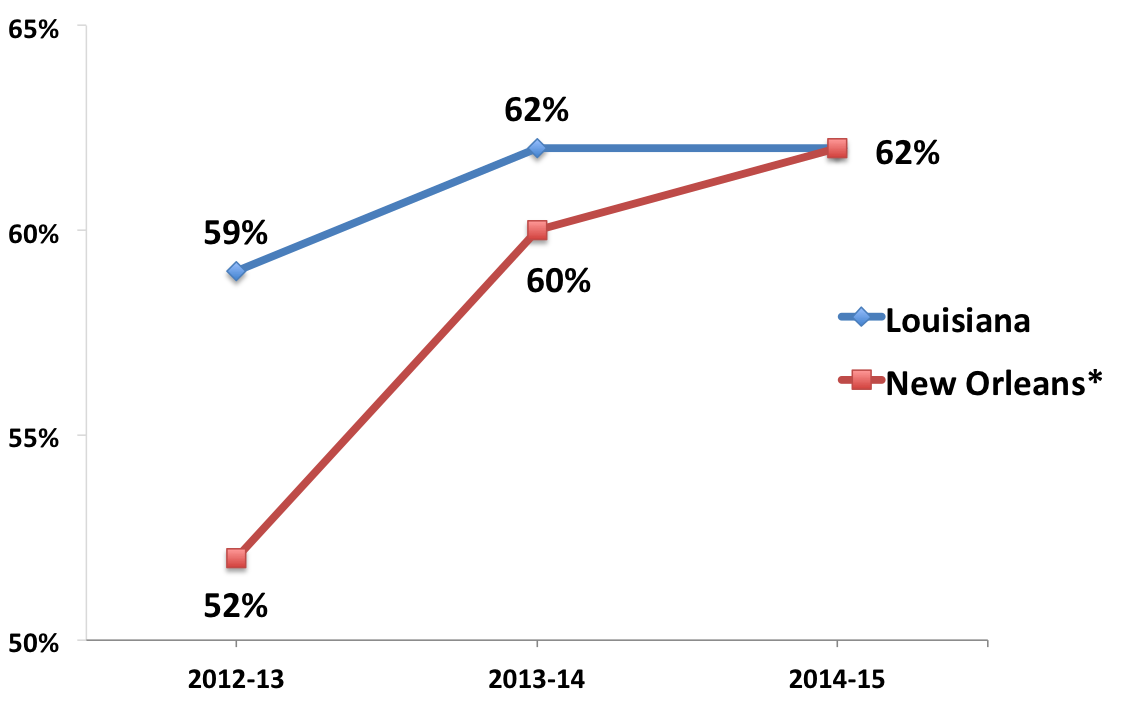
2015 EOC Results – New Orleans ties the state!

 
New Orleans high school performance on End-of-Course tests (EOCs) continues to improve.
  • New Orleans citywide, including Type 2 charters, is now performing at the state average.
  • New Orleans is the 5th most improved district in the state.
  • OPSB and RSD-NO combined is in the top 50% statewide and is ranked of #31 out of 69 parishes. This is the first academic ranking where New Orleans is in the top half of the state!
Percent Proficient on EOCs
EOCs_2013_to_2015_NO_vs_State
* Includes all New Orleans Schools – OPSB, RSD-NO, and two Type 2 charters.

Continue reading

By the Numbers: Student and School Performance

This fall, Louisiana’s Department of Education will release new baseline scores for schools and for student performance. As we move to the new academic standards, Educate Now! will no longer use 2005 as a comparison point. Instead, our new baseline will be the 2014-15 school year.

It’s time to focus on what’s next for New Orleans public schools, but before we move on, Educate Now! wants to thank the educators, administrators and volunteers who have worked tirelessly over the past decade to help our students succeed.

Ten years after Katrina, here’s how New Orleans public schools have changed.

SCHOOL AND STUDENT PERFORMANCE

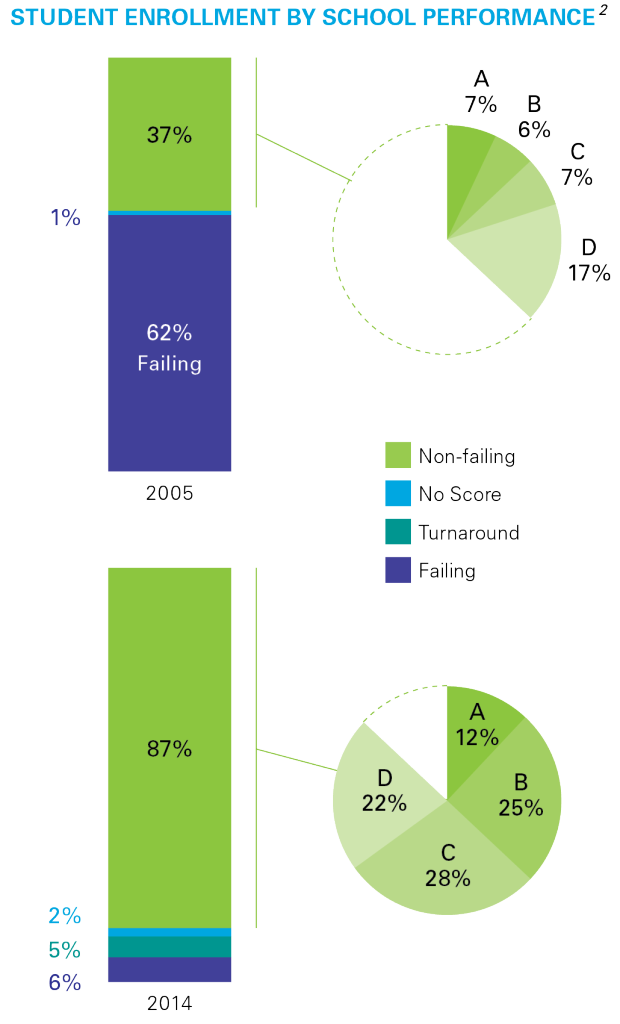
The percentage of students enrolled in failing schools fell from 62% to 6%. The percentage enrolled in A or B schools increased from 13% to 37%.1
en-enrollment-by-performance-072715
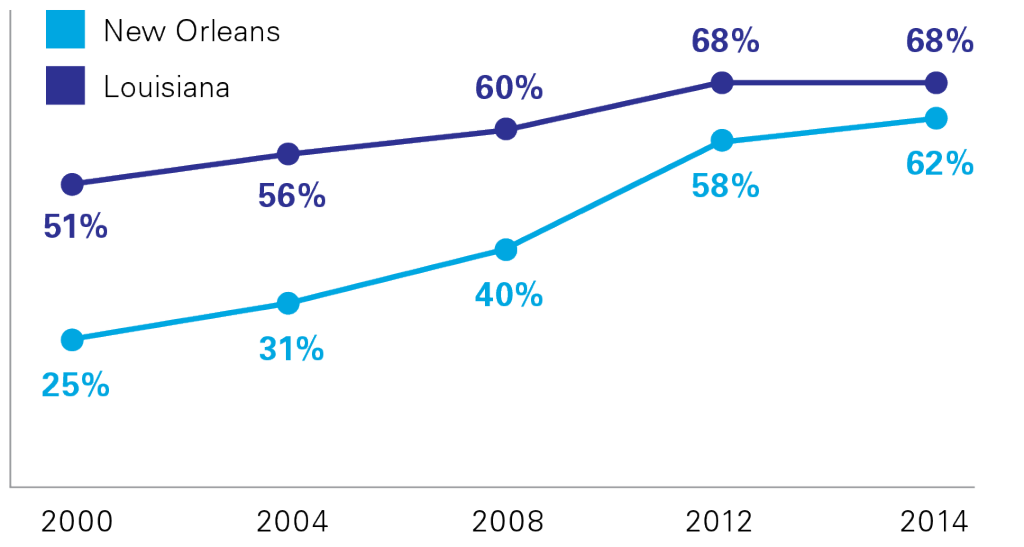
The percentage of students proficient on state tests increased from 25% to 62%.
aen-performance-all-students-072715 no header
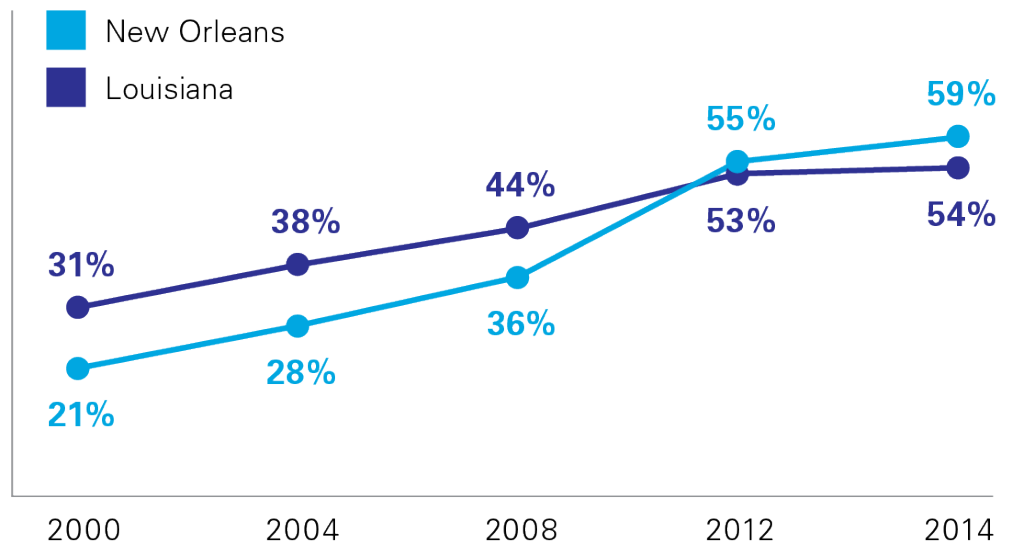
The percentage of Black students proficient on state tests increased from 21% to 59%, and we now outperform the state by 5 percentage points.
aperformance-black-students


Continue reading

ICYMI: 10th Anniversary Data Available on DOE Website

In Case You Missed It (ICYMI) … Your mini news clipping

The Louisiana Department of Education has created a special webpage with information on RSD and OPSB schools from 2004 to the present. 10 Years After Hurricane Katrina: The New Orleans Education Landscape Today includes analyses and data on enrollment and demographics, academic outcomes, high school performance, African-American student performance, students with disabilities, school facilities and ensuring equitable access for all students.

Congratulations to the class of 2015! Watch highlights from the second annual Senior Shout Out, a celebration of the 2,500 New Orleans seniors who received $75 million in scholarships and are going to over 300 colleges and universities.

The Times-Picayune takes a comprehensive look at changes in special education since Katrina, beginning with An introduction, and continuing with What happened after the storm?, One child learns to love school, Graduation rates rise and other successes, Problems that remain, and Is there life after high school?

Continue reading

By the Numbers: The Graduating Class of 2014

The state just released new data on cohort graduation rates and college enrollment rates. Continuing our By the Numbers series, Educate Now! takes a look at the class of 2014.

THE GOOD NEWS

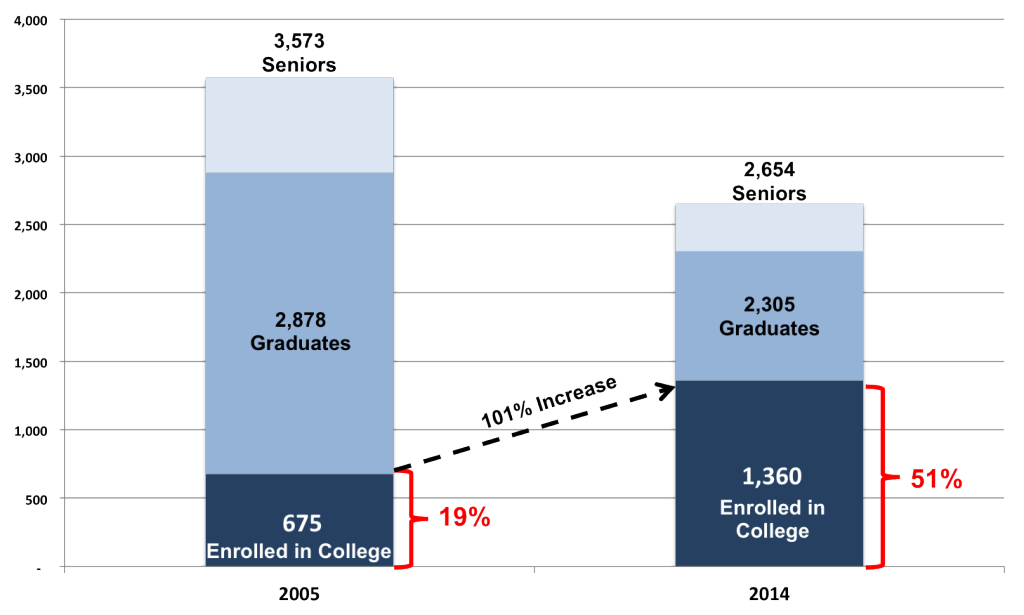
100% more students enrolled in college

In 2005, only 675 Orleans Parish Public School graduates enrolled in a two or four year college the following fall, compared to 1,360 graduates from New Orleans’ class of 2014.

Even though the 2014 senior class was much smaller than the 2005 senior class (2,654 students versus 3,753), our schools sent a much higher proportion of students to college. This tremendous increase is a testament to the hard work of educators in New Orleans.

College_Enrollment_2005_vs_2014

 2005 vs. 2014

2005 2014
Number of seniors
3573 2654
Number of graduates
2878 2305
Number enrolled in college
675 1360
Percent of senior class in college
19% 51%

65% of Black males graduated on time: New Orleans outperforms nation

With a 65% Black male graduation rate1, New Orleans is now outperforming the state and the nation. The Schott Foundation recently published Black Lives Matter: The Schott 50 State Report on Public Education and Black Males. In 2013:
  • The national graduation rate for Black males was 59%.
  • Louisiana’s graduation rate for Black males was 59%.
  • New Orleans graduation rate for Black males was 65%.

Continue reading

New Orleans by the Numbers: Public School Enrollment

Educate Now! looks at the public school student enrollment over the past ten years – from October 1, 2004 (the last data before Katrina) to this school year.

The Highlights

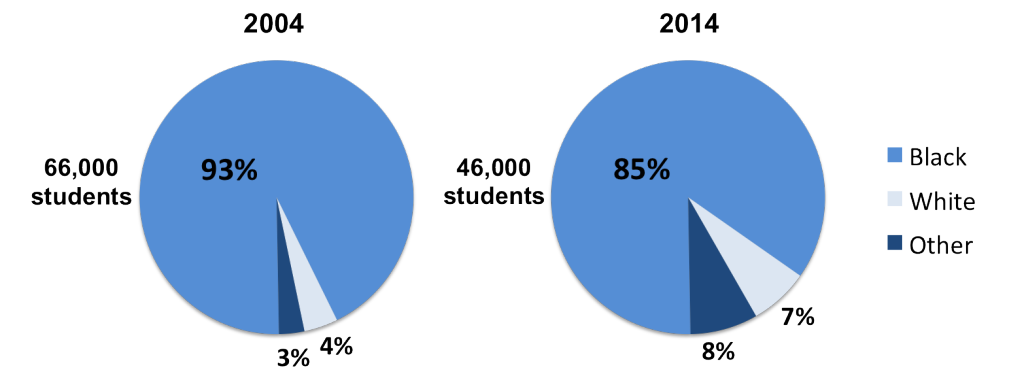
Schools are serving a more ethnically diverse student population.

Enrollment Citywide
Enrollment_demographics_04_vs_14


A higher percentage of students are economically disadvantaged*.
 

Economically_Disadvantaged_04_vs_14

Continue reading

Diversity in School Choice

This guest editorial appeared on Nola.com. Nola.com edited it for length, but the full version appears below.

New Orleans charter schools are all the same? Not true: Leslie Jacobs

Diversity_in_School_ChoiceOne key component of New Orleans’ innovative school model is school choice. When schools have to compete for students, they have to perform well or students and parents will choose to go elsewhere. Likewise, choice encourages parents to be more engaged in their child’s education by compelling them to be an active participant in deciding what school their child should attend.

An often repeated critique, however, is that while families have choice, they lack a diversity of choices: New Orleans charters are all the same.

This stereotype was echoed in the recent Cowen Institute report on New Orleans schools, which stated, “the variation in school design is largely limited to high-stakes standards-based teaching and strict discipline policies.”

So is there any truth to this criticism? Are most charter schools in New Orleans carbon copies of each other just focused on tests and discipline?

An argument can be made that statement was true five years ago. It is not true today.

In the early years, many of the charter schools did look alike and were very focused on establishing their school culture, discipline and academic programs.

But one of the key advantages of a decentralized school system is the freedom to innovate and respond to needs quicker and better. Over the past few years, schools have responded to families’ desire for diverse educational and extracurricular opportunities. And new charters continue to recognize gaps in the city’s educational landscape and launch schools to meet these needs.

Continue reading