By the Numbers: Student and School Performance

This fall, Louisiana’s Department of Education will release new baseline scores for schools and for student performance. As we move to the new academic standards, Educate Now! will no longer use 2005 as a comparison point. Instead, our new baseline will be the 2014-15 school year.

It’s time to focus on what’s next for New Orleans public schools, but before we move on, Educate Now! wants to thank the educators, administrators and volunteers who have worked tirelessly over the past decade to help our students succeed.

Ten years after Katrina, here’s how New Orleans public schools have changed.

SCHOOL AND STUDENT PERFORMANCE

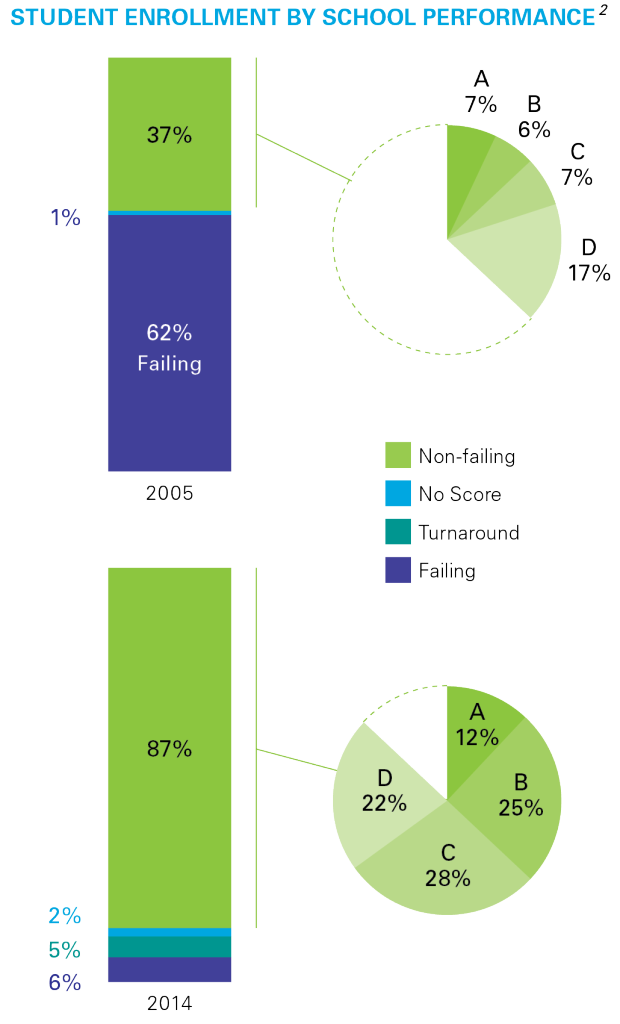
The percentage of students enrolled in failing schools fell from 62% to 6%. The percentage enrolled in A or B schools increased from 13% to 37%.1
en-enrollment-by-performance-072715
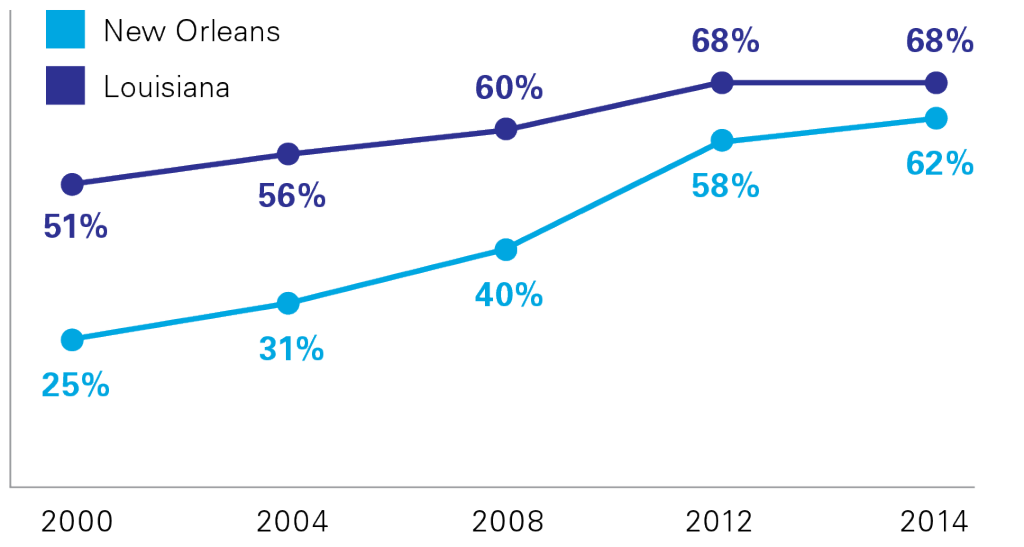
The percentage of students proficient on state tests increased from 25% to 62%.
aen-performance-all-students-072715 no header
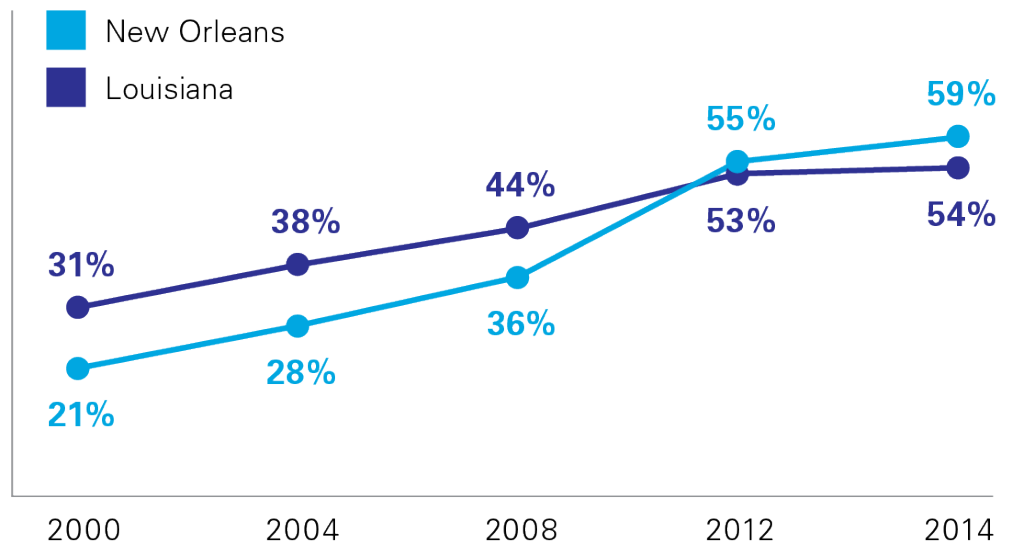
The percentage of Black students proficient on state tests increased from 21% to 59%, and we now outperform the state by 5 percentage points.
aperformance-black-students


Continue reading

By the Numbers: High School Performance 2005 vs. 2014

p The state just released the 2014 ACT scores for public schools. Continuing our By the Numbers series, Educate Now! takes a look at high school performance.

ACT Performance

New Orleans has seen strong gains since 2005.

The growth in ACT scores comes even as the percentage of seniors taking the test has increased significantly. (The state now requires students to take the ACT as part of high school accountability; in 2005, students were not required to take the ACT.) Since 2005, as the percentage of seniors taking the ACT increased, New Orleans improved its composite score1 from 17 to 18.4, while the state declined from 19.8 to 19.2. Both RSD and OPSB have seen gains in their ACT scores2.

  • During this time (2005 to 2014), the RSD improved its ACT average by 2 points, more than any other district in the state. It is one of only 5 districts that improved more than 1 point during this time.
  • OPSB improved by 0.8 points.
ACT Scores Over Time
  Class of 2005 Class of 2014 Change
OPSB
19.7 20.5 0.8
Schools transferred to RSD
14.4 16.4 2
New Orleans (OPSB + RSD)
17 18.4 1.4
Louisiana
19.8 19.2 – 0.6


If comparing performance, RSD schools serve a very different population than OPSB, with more African American students, more poor students, and more students with special needs. Some OPSB high schools have selective admissions, and only three of seven OPSB high schools participate in EnrollNOLA (OneApp). RSD data includes the alternative high schools in the city, and every RSD high school is open-admissions and participates in EnrollNOLA.

Continue reading