New Orleans by the Numbers: Enrollment by School Performance


Educate Now! combined October 1 enrollment numbers with School Performance Scores to view student enrollment by school letter grade.

  • Currently, 20% of students are enrolled in A schools (up one point from 2016), and 28% of students are enrolled D, F or T schools, the same as last year. The percentage of students in B schools fell 6 points from last year, and the percentage in C schools rose 4 points.

Enrollment by School Performance

School Grade
2016
2015
A 20% 19%
B 12% 18%
C 35% 31%
D 21% 20%
F 6% 5%
T 1% 3%
No SPS 4% 4%
 

National Coverage of New Orleans K-12 Education Ten Years After Katrina

The 10th Anniversary of Hurricane Katrina generated extensive national coverage of New Orleans K-12 education reforms.

Excerpt from President Obama’s speech

“Working together, we’ve transformed education in this city. Before the storm, New Orleans public schools were largely broken, leaving generations of low-income kids without a decent education. Today, thanks to parents and educators, school leaders, nonprofits, we’re seeing real gains in achievement, with new schools, more resources to retain and develop and support great teachers and principals. We have data that shows before the storm, the high school graduation rate was 54 percent. Today, it’s up to 73 percent. Before the storm, college enrollment was 37 percent. Today, it’s almost 60 percent. We still have a long way to go, but that is real progress. New Orleans is coming back better and stronger.”

Broadcast Media

Superintendent John White on MSNBC

NBC on the state of schools post Katrina

Roland Martin on Troy Simon, who could not read until age 14 and is now at senior at Bard College

The 74: Videos of Past, Present and Future of New Orleans schools

NBC highlights New Orleans education and includes the YouthRise rally

Continue reading

By the Numbers: Who Is Leading Our Schools?

By the Numbers: Who is Leading Our Schools?

There has been a lot of talk – from both friends and foes of New Orleans K-12 Ed Reform – about outsiders coming in to run the schools. So, Educate Now! surveyed every OPSB and RSD school, direct run and charter, to get a profile of who is leading our schools and whether they were here before the levees broke.

Let’s take a look at the numbers.

There are 77 schools for the 2015-16 school year and 85 school leaders, as some schools have more than one leader.

2015 School Leaders
District African-
American
White Other Lived in N.O.
pre-Katrina
RSD-NO
30 24 4 26
OPSB
13 13 1 21
New Orleans
43 37 5 47
Percent
51% 43% 6% 55%

The education reforms post-Katrina have been the work of veteran and new educators, and the work of New Orleanians who were here before the storm as well as others who moved here to be part of rebuilding a great city.

Our educators are more ethnically diverse, but a majority of our school leaders and a majority of our teachers are still African-American.

As we commemorate the 10-year anniversary of Katrina and the beginning of another school year, I hope we can join together to celebrate the remarkable progress that has been made in our schools and thank all of our teachers and administrators, both those from New Orleans and those who moved here more recently, as they work tirelessly to provide educational opportunities for our students.

By the Numbers: Teacher Diversity

There has been a lot of talk about changes in teacher ethnicity since Katrina. Let’s take a look at the numbers.

In 2012-13, the most recent year for which we have district data, the makeup of New Orleans teachers (OPSB + RSD) was 51% African-American, 45% white and 4% other.

District
African-American
White
Other
RSD-NO 53% 43% 4%
OPSB 44% 51% 5%
New Orleans 51% 45% 4%

How does New Orleans compare to other cities?
Note: Educate Now! used data it could find online. Not all years compared are the same.1

  • In Louisiana in 20% of teachers were African-American. Nationally, 7% were African-American.
  • In Atlanta, 74% of teachers were African-American. Washington, DC was similar to New Orleans, while Chicago and New York City had a smaller percentage of African-American teachers.
City/District
African-American
White
Atlanta
74%
22%
Washington, D.C.
52%
36%
New Orleans
51%
45%
Chicago
24%
50%
New York City
20%
49%
Louisiana
20%
74%
National
7%
82%

How do we compare to pre-Katrina?

In 2003-04 (the state did not publish data for 2004-05 school year), 74% of New Orleans teachers were African-American, 24% white and 2% other.
___________________
1 Teacher data for Chicago are from 2013-14. Data for the national average and for other cities used for comparison are from 2011-12.


By the Numbers: High School Performance 2005 vs. 2014

p The state just released the 2014 ACT scores for public schools. Continuing our By the Numbers series, Educate Now! takes a look at high school performance.

ACT Performance

New Orleans has seen strong gains since 2005.

The growth in ACT scores comes even as the percentage of seniors taking the test has increased significantly. (The state now requires students to take the ACT as part of high school accountability; in 2005, students were not required to take the ACT.) Since 2005, as the percentage of seniors taking the ACT increased, New Orleans improved its composite score1 from 17 to 18.4, while the state declined from 19.8 to 19.2. Both RSD and OPSB have seen gains in their ACT scores2.

  • During this time (2005 to 2014), the RSD improved its ACT average by 2 points, more than any other district in the state. It is one of only 5 districts that improved more than 1 point during this time.
  • OPSB improved by 0.8 points.
ACT Scores Over Time
  Class of 2005 Class of 2014 Change
OPSB
19.7 20.5 0.8
Schools transferred to RSD
14.4 16.4 2
New Orleans (OPSB + RSD)
17 18.4 1.4
Louisiana
19.8 19.2 – 0.6


If comparing performance, RSD schools serve a very different population than OPSB, with more African American students, more poor students, and more students with special needs. Some OPSB high schools have selective admissions, and only three of seven OPSB high schools participate in EnrollNOLA (OneApp). RSD data includes the alternative high schools in the city, and every RSD high school is open-admissions and participates in EnrollNOLA.

Continue reading

New Orleans Schools: Then and Now

In honor of the 9 year anniversary of Katrina, Danielle Dreilinger compiled a snapshot of New Orleans schools then and now.

For those of you who were here before Katrina, it may bring back some interesting memories. For those of you who have moved here since the storm, thanks for being part of the recovery of the city and of our schools.

You can see how far we have come in 9 years … and how far we still have to go.

New Orleans public schools pre-Katrina and now, by the numbers


In the News – Superintendent Search Stalled (again)

New Orleans Superintendent Search – Stalled

In Orleans Parish schools, two years of drift, missed opportunities
Stan Smith has been OPSB’s Interim Superintendent for two years, much longer than anyone expected, and longer than what is probably healthy for the district. The Times-Picayune spoke with academics, consultants and school officials, who all say the district is drifting – wasting an opportunity to re-envision itself and possibly to bring the city’s schools back together again.

Impasse on Orleans Parish superintendent search; president criticized for construction contract
At its last meeting, OPSB voted not to proceed with either of the two finalists for the superintendent’s position – Kriner Cash, former Memphis superintendent, and Edmond Heatley, most recently education minister of Bermuda. A third finalist, Veronica Conforme, former New York City schools chief operating officer, dropped out of the running just before the meeting. The meeting was dominated by fallout from the board’s approval of a construction contract that included family members of President Nolan Marshall Jr. as subcontractors on the job. Marshall said he has asked U.S. Attorney Kenneth Polite to investigate the situation to determine if there was any wrongdoing.

Radio show erupts into argument between Orleans Parish School Board members
The personal animosity between OPSB President Nolan Marshall Jr. and board member Ira Thomas shone through in a in a recent interview on WBOK radio as the two hurled accusations at one another.

Common Core Updates

Politics do make strange bedfellows:

The Louisiana Association of Educators came out in support of Governor Jindal while Dan Juneau, the former President of the Louisiana Association of Business and Industry for over 25 years, called Bobby Jindal’s attempts to scuttle Common Core “shameful.”

Higher Ed weighs in:

Louisiana’s Board of Regents has advised its colleges of education to continue to prepare teachers to teach to the Common Core.

 It is still about the tests:

As Educate Now! outlined in its recent blog post, the governor cannot force BESE to adopt new standards. His focus is on preventing the state from using test questions developed by a “consortium of states.” This would stop BESE from using PARCC or Smarter Balance test questions that are aligned with Common Core and that allow Louisiana to compare the performance of its students to other students across the country.

The governor suspended the contract of the test vendor, DRC. This suspension led Superintendent John White to notify districts that the summer retest could not be graded because DRC’s contract includes grading of all tests. The Jindal administration then “clarified” their suspension saying it only applies to preventing the contractor from purchasing test questions from the two state consortiums.

Continue reading

Common Core: What happened last week?

Latest on Common Core – Round 2 

Last week, Governor Bobby Jindal played to his national ambitions and announced his plans to take Louisiana out of Common Core and PARCC. The Louisiana Department of Education and the State Board of Elementary and Secondary Education (BESE) responded saying they plan to stay the course on Common Core and PARCC, resulting in confusion among educators and the public.

Educate Now! will try and cut through the clutter and distill the salient points.

First, a primer: 

Standards: What we expect students to know and be able to do. In the past, every state had its own standards, but in 2010, BESE adopted the Common Core State Standards (CCSS), along with more than forty other states.

Curriculum: What teachers use in the classroom to teach the standards. Districts, schools and teachers have the autonomy to pick the actual teaching materials and manner in which they want to teach. The state has issued curriculum guides to assist educators, but there is no set national or state curriculum.

Tests: How we assess student mastery of the standards. Well-designed tests are expensive and take time to develop. Louisiana joined a consortium of states to create the Partnership for Assessment of Readiness for College and Careers, or PARCC test, while a different consortium of states created the Smarter Balance test. Both groups began working on the tests in 2010 and field tested questions for quality and rigor in 2013 and 2014. Fifty thousand Louisiana students took a PARCC field test this year, giving schools experience in administering the test while further “testing” the questions for quality, clarity and rigor.

Now to last week’s events … 

Common Core: The governor will not win this one.

The standards are still in place, and the governor cannot force BESE to adopt new standards. While Jindal’s executive order asked the legislature to adopt new standards, he cannot require them to do so, and the legislature just rejected this request last session.

Continue reading

The Promise of Career Prep

This guest editorial appeared in the Times-Picayune, and I wanted to share it with you.

Career prep can improve lives, aid local economy: Leslie Jacobs

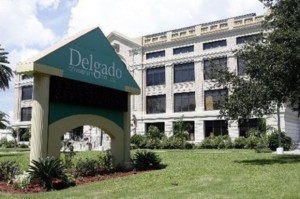
Delgado Image

In New Orleans, less than half (48 percent) of African-American men of working age are employed – the rest are either out of work or out of the workforce. This employment crisis threatens the livelihoods of individuals and families, as well as the fabric of our city. Our new system of schools must evolve to prepare all of our students for meaningful careers.

Let’s be clear: Our schools have made tremendous gains.

Our K-8 schools have increased the percentage of eighth-graders performing on grade level in math and English from 28 percent pre-storm to 67 percent last spring, just one point shy of the state average.

The graduating class of 2013 is in much better shape than the class of 2005. In 2005, only about 50 percent of our high school students graduated. Today, close to 80 percent of our high school students will graduate. And we have increased the percentage of graduates qualifying for a four-year TOPS college scholarship from 16 percent to 26 percent.

These gains are truly impressive.

But what about the large percentage of our high school graduates who are not yet ready to succeed at a four-year college? How are we preparing them for jobs that provide livable wages and career opportunities? Continue reading

Student Enrollment Continues to Rise; Almost 80% at Charters

Educate Now! collected enrollment data for all New Orleans public schools. This unofficial October 1 student count shows:

Student enrollment is 42,198.

An increase of 2,321 students from last year and a 64% increase since 2006, the first full year after Katrina.

78% of New Orleans students now attend charter schools, up from 71% last year.

New Orleans Public Schools
October 1 Student Count (all students)

Year OPSB Direct-Run OPSB Charter OPSB
Direct and
Charter
RSD Direct-Run RSD Charter RSD
Direct and
Charter
BESE
Type 2
Charter
TOTAL % at Charter Schools
2004 65,349 N/A 65,349 N/A 261 261 762 66,372 2%
2006 2,904 6,246 9,150 8,619 7,200 15,819 682 25,651 55%
2007 2,630 7,089 9,719 11,608 10,040 21,648 782 32,149 56%
2008 2,806 7,402 10,208 12,724 12,177 24,901 846 35,955 57%
2009 2,773 7,606 10,379 11,933 14,821 26,754 918 38,051 61%
2010 2,790 7,797 10,587 8,779 19,433 28,212 1078 39,877 71%
2011 3,047 7,921 10,968 6,398 23,285 29,683 1,547 42,198 78%
Sources: Louisiana Department of Education for October 1, 2004 through October 1, 2010 enrollment. The October 1, 2011 enrollment is self-reported by the RSD, OPSB and individual charter schools. Note: This chart does not include the Louisiana Virtual Charter Academy’s enrollment, since most of its students do not live in New Orleans.