K-8 Student Performance Stalls
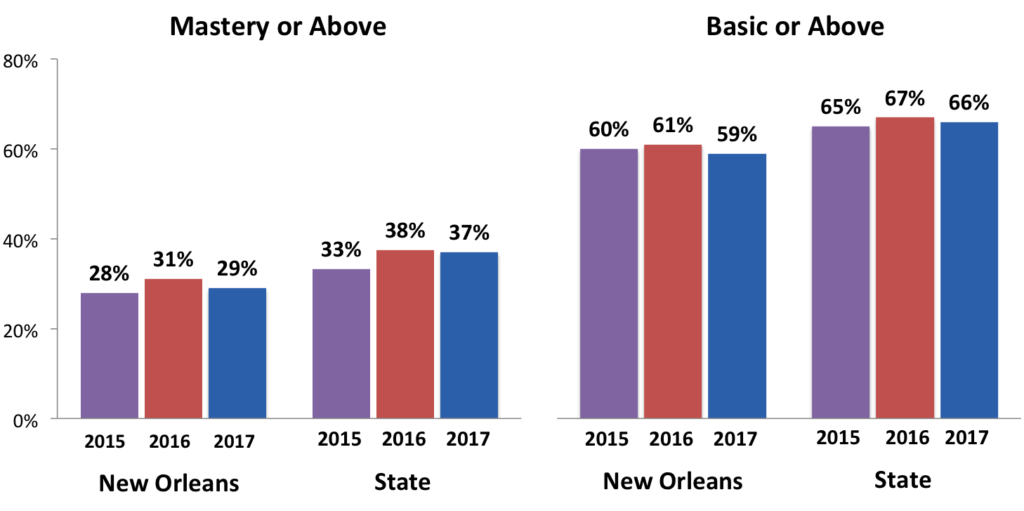
The state has released the results of the 2016-17 LEAP tests for grades 3-8. While a number of New Orleans schools showed improvement, fewer students overall met the new more rigorous Mastery standard, and the city fell in state rankings.
- New Orleans student performance in English decreased from 35% to 34% Mastery in English (-1) and from 27% to 25% Mastery in math (-2).
- Statewide, the percent of students scoring Mastery in English improved from 41% to 42% (+1) and dropped in math, from 34% to 32% (-2).
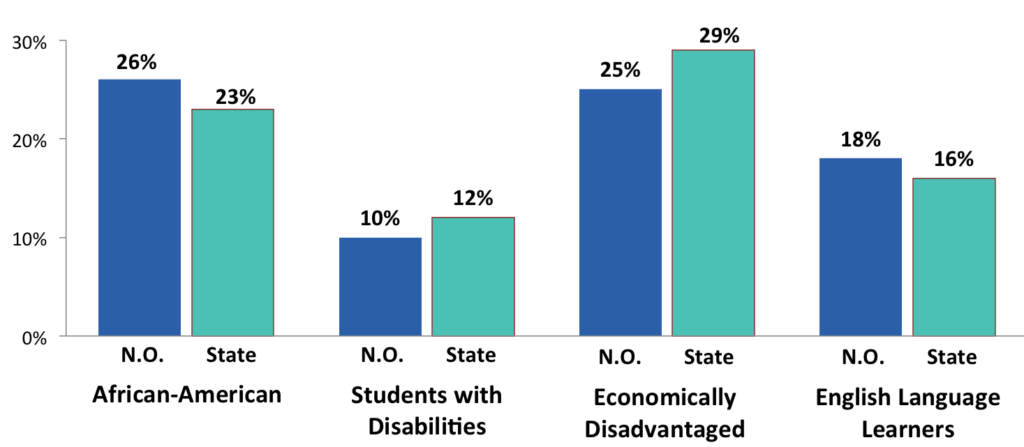
- New Orleans outperformed the state average for African-American students and English Language Learners.
- New Orleans’ district rank fell from 47 to 50.
LEAP Performance All Students 2015 to 2017
English and Math Combined

Subgroup Performance
African American students in New Orleans outperformed the state average by 3 percentage points, and our English Language Learners outperformed the state by 2 percentage points. Students with disabilities trailed the state by 2 percentage points, and our economically disadvantaged students trailed the state by 4 points.

District Performance
The state began transitioning to the higher standards in 2014. Since then, New Orleans’ performance in relationship to other districts has remained relatively stable.
- This year, we rank 50th out of 69 districts for the percent Mastery or above, outperforming 15 districts and tied with 4 others.
- In 2016, we ranked 47th out of 69 districts, outperforming 22 districts.
- In 2015, we ranked 45th, outperforming 21 districts and tied with 3 others .
- In 2014, we ranked 46th, outperforming 22 districts and tied with 1 other.
How did our schools perform?
This chart shows school performance on the LEAP tests for English and math. It does not include science and social studies. For a complete list for each school, download the state’s 2017 school achievement report for all grades and subjects.
|
School Name
|
Mastery or Above | Basic or Above | ||
| 2017 | 2016 | 2017 | 2016 | |
|
Lusher Charter School
|
88% | 88% | 98% | 98% |
|
Lake Forest Elementary Charter School
|
85% | 85% | 98% | 98% |
|
Bricolage Academy
|
65% | 84% | ||
|
Edward Hynes Charter School
|
61% | 59% | 87% | 89% |
|
Lycee Francais de la Nouvelle-Orleans
|
59% | 62% | 85% | 87% |
|
Audubon Charter School
|
58% | 60% | 85% | 86% |
|
International School of Louisiana
|
57% | 52% | 88% | 84% |
|
Alice M. Harte Elementary Charter School
|
46% | 52% | 80% | 82% |
|
Louisiana Statewide
|
37% | 38% | 66% | 67% |
|
Lafayette Academy
|
37% | 34% | 67% | 67% |
|
KIPP Central City Academy
|
36% | 40% | 70% | 74% |
|
KIPP Central City Primary
|
36% | 33% | 74% | 69% |
|
Morris Jeff Community School
|
36% | 35% | 66% | 71% |
|
Benjamin Franklin Elem. Math and Science
|
35% | 42% | 74% | 77% |
|
Robert Russa Moton Charter School
|
32% | 41% | 72% | 77% |
|
James M. Singleton Charter School
|
32% | 21% | 72% | 52% |
|
Arthur Ashe Charter School
|
31% | 30% | 66% | 66% |
|
Mary Bethune Elementary Literature/Tech
|
31% | 41% | 71% | 76% |
|
Phillis Wheatley Community School
|
30% | 30% | 55% | 58% |
|
New Orleans (OPSB + RSD)
|
29% | 31% | 59% | 61% |
|
Esperanza Charter School
|
28% | 35% | 57% | 67% |
|
Martin Behrman Charter Academy
|
27% | 31% | 61% | 63% |
|
Akili Academy of New Orleans
|
27% | 26% | 59% | 56% |
|
Samuel J. Green Charter School
|
27% | 26% | 67% | 65% |
|
Wilson Charter School
|
26% | 22% | 60% | 55% |
|
Langston Hughes Charter Academy
|
26% | 22% | 57% | 53% |
|
KIPP Believe College Prep
|
25% | 32% | 56% | 65% |
|
ENCORE Academy
|
25% | 32% | 55% | 58% |
|
Harriet Tubman Charter School
|
24% | 31% | 54% | 62% |
|
Einstein Middle Sarah T. Reed
|
24%
|
NA
|
28%
|
NA
|
|
KIPP McDonogh 15
|
24% | 24% | 53% | 58% |
|
Fannie C. Williams Charter School
|
23% | 18% | 56% | 52% |
|
Homer A. Plessy Community School
|
23% | 22% | 44% | 42% |
|
KIPP New Orleans Leadership Academy
|
23% | 21% | 53% | 53% |
|
Edgar P. Harney Spirit of Excellence Academy
|
22% | 23% | 58% | 55% |
|
Einstein Charter School
|
22% | 28% | 53% | 57% |
|
ReNEW SciTech Academy at Laurel
|
22% | 29% | 51% | 64% |
|
Dr. Martin Luther King Charter School
|
21% | 21% | 59% | 58% |
|
Mary D. Coghill Charter School
|
21% | 32% | 53% | 64% |
|
Einstein Sherwood Forest
|
21%
|
NA
|
32%
|
NA
|
|
Einstein Village De L’Est
|
21% | 28% | 31% | 57% |
|
ReNEW Dolores T. Aaron Elementary
|
20% | 26% | 51% | 59% |
|
Pierre A. Capdau Learning Academy
|
20% | 24% | 51% | 56% |
|
Dwight D. Eisenhower Academy
|
20% | 18% | 50% | 49% |
|
Paul Habans Charter School
|
19% | 17% | 51% | 46% |
|
Success Preparatory Academy
|
19% | 26% | 51% | 60% |
|
Joseph A. Craig Charter School
|
18% | 19% | 43% | 43% |
|
Mildred Osborne Charter School
|
18% | 21% | 46% | 49% |
|
Lawrence D. Crocker College Prep
|
18% | 19% | 47% | 50% |
|
Sophie B. Wright Charter School
|
18% | 16% | 35% | 46% |
|
ReNEW Cultural Arts Academy at Live Oak
|
17% | 26% | 46% | 57% |
|
ReNEW Schaumburg Elementary
|
16% | 23% | 42% | 54% |
|
Arise Academy
|
15% | 15% | 43% | 38% |
|
Nelson Elementary School
|
15% | 14% | 42% | 40% |
|
Mahalia Jackson Elementary School
|
14% | 40% | 43% | 68% |
|
Gentilly Terrace Elementary School
|
13% | 16% | 44% | 48% |
|
ReNEW City Park
|
11% | 16% | 38% | 46% |
|
Sylvanie Williams College Prep
|
11% | 21% | 31% | 51% |
|
Milestone Academy *
|
9% | 22% | 35% | 52% |
|
McDonogh #32 Literacy Charter School
|
9% | 12% | 33% | 38% |
|
William J. Fischer Accelerated Academy
|
8% | 9% | 29% | 27% |
|
McDonogh 42 Charter School *
|
6% | 11% | 27% | 38% |
|
Crescent Leadership Academy
|
0% | 7% | 0% | 16% |
* School closed at the end of 2016-17
Shout Outs!
Congratulations to these six schools for gaining 3 points or more in the percentage of students scoring Mastery or above!
|
School Name
|
% Mastery or Above |
% Basic or Above |
|
James M. Singleton Charter School
|
+ 10.5 pts | + 20.2 pts |
|
Fannie C. Williams Charter School
|
+ 4.9 pts | + 3.7 pts |
|
International School of Louisiana
|
+ 4.8 pts | + 4.8 pts |
|
Wilson Charter School
|
+ 4.8 pts | + 5.1 pts |
|
Langston Hughes Charter Academy
|
+ 4.1 pts | + 3.6 pts |
|
KIPP Central City Primary
|
+ 3.3 pts | + 4.7 pts |
|
Lafayette Academy
|
+ 3.0 pts
|
+ 0.36 pts
|
