K-8 Test Scores Released

K-8 Student Performance Stalls

The state has released the results of the 2016-17 LEAP tests for grades 3-8. While a number of New Orleans schools showed improvement, fewer students overall met the new more rigorous Mastery standard, and the city fell in state rankings.

  • New Orleans student performance in English decreased from 35% to 34% Mastery in English (-1) and from 27% to 25% Mastery in math (-2).
  • Statewide, the percent of students scoring Mastery in English improved from 41% to 42% (+1) and dropped in math, from 34% to 32% (-2).
  • New Orleans outperformed the state average for African-American students and English Language Learners.
  • New Orleans’ district rank fell from 47 to 50.

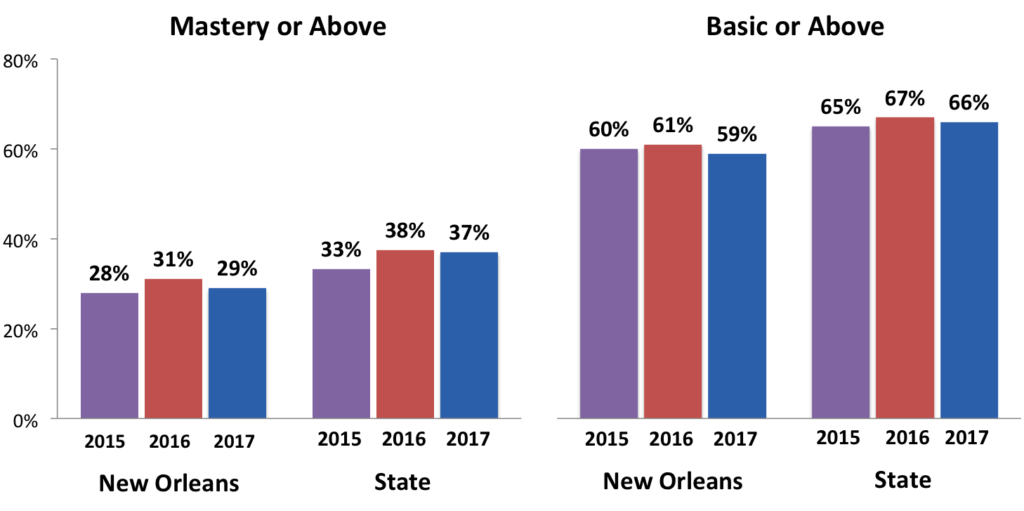
LEAP Performance All Students 2015 to 2017
English and Math Combined

Continue reading

Latest Cohort Graduation Rates Released

4-Year Cohort Graduation Rates Released

The Orleans Parish School Board and Recovery School District have released the latest 4-year cohort graduation rates. The citywide 4-year graduation rate was 72.1% for the class of 2016,1 a drop of 3.3 percentage points from 2015. Twenty percent of the students who did not graduate in four years remained in school and were enrolled for a fifth year in the fall of 2016.  

Statewide, the graduation rate fell from 77.5% to 77%.

While the graduation rate of 72.1% is a huge improvement from the 54% graduation rate in 2005, these results are still disappointing. We are not graduating 1 in 4 students, even including students who take longer than 4 years to graduate, and the gap to the state average is getting larger, not smaller.

Need to Get Better

The unification of the schools under OPSB represents a new chapter in public education and the opportunity for some new strategies. To improve the graduation rate, we need to:

  • Begin using data to identify drop outs in real time. By October, we can identify students who should be enrolled in school but are not. This information needs to be generated by the central office, as any individual school does not know if a student has dropped out or decided to attend another school. Once we know in a timely fashion which students dropped out, the district can partner with schools and other agencies to find these students and get them re-enrolled.
  • Diversify our high schools. We need more alternative high schools to better address struggling students’ needs. We also need more high schools that offer meaningful career-technical education for interested students.
  • Work to expand access to mental and behavioral health care for students before and during high school. Schools cannot do it alone.
  • Improve our K-8 performance, as discussed below.

Comparing New Orleans to Other Districts

Continue reading

2016 School Performance

The state has released the 2016 School Performance Scores. 

Highlights

  • Performance has improved. The District Performance Score for New Orleans (OPSB+RSD) increased 1.5 points after three years of no change.
  • New Orleans is only one-tenth of a point away from receiving a B letter grade.
  • While performance has improved, New Orleans did not keep pace with other districts. Our ranking went down two spots from last year – from 41st to 43rd.
  • Our schools were challenged to improve with the new, higher standards; 8 schools went up a letter grade, and 16 schools went down a letter grade.

District Performance


The District Performance Score (DPS) is the most comprehensive measurement of school and student performance. The DPS for New Orleans includes all students, all tests, and all grade levels for OPSB and RSD (including students that attended schools now closed). 


  • New Orleans’ DPS went up 1.5 points, from 83.4 to 84.9, the first change in three years.
  • New Orleans received a C letter grade again this year, but we are now just one tenth of a point away from a B.
  • New Orleans is ranked 43rd out of 69 districts, down two spots from last year.

Download the 2016 District Performance Scores for New Orleans Schools (xlsx).

Continue reading

Look How Far We’ve Come: OPSB Approves School Unification Plan

“Just Think How Far We’ve Come”

Superintendent Henderson Lewis Jr., August 29, 2016

The Orleans Parish School Board unanimously approved a Unification Plan outlining the return of schools to the elected board. 

With the adoption of this plan, the school board has embraced a shared vision for the unified school district that builds upon the changes since Katrina and commits to continuing improvement.

The Vision

A locally elected school board will govern a system of schools in a district that is over 90% charter schools, provides school choice for all families, and expressly commits to ensuring equity and recognizing the need for differentiated resources based on student need.

A slide from the superintendent’s presentation to the school board captures this vision:  

superintendents_presentation_slide_3

Continue reading

K-8 Student Performance Improves

x
The state has released the results for the 2015-16 LEAP tests for grades 3-8. This is the second year of new tests aligned to more rigorous standards. 

How Did New Orleans Do?

  • New Orleans student performance improved, but lagged the state.
  • New Orleans outperformed the state average for African-American students and English Language Learners.

Performance: All Students

  • The percentage of New Orleans students reaching the state’s new proficiency goal of Mastery or above grew from 28% to 31%, a gain of 3 points; the state improved by 5 points. 
  • The percentage of New Orleans students performing Basic or above grew from 60% to 61%, a gain of 1 point; the state improved by 2 points.

Gains in LEAP Performance in English and Math

LEAP_Performance_2015_vs_2016

These results are for English and math only. To view all subjects, view the state’s 2016 Tests by District Report.

Continue reading

High School Performance: ACT and EOC Test Results

x
The state has released ACT and End of Course Test results for 2015-16. The results are disappointing and mark a pause in the steady progress we’ve made toward closing the gap with the state average.

  • The average ACT Composite score for New Orleans (OPSB + RSD) remained flat at 18.8, while the state average improved slightly from 19.4 to 19.5. New Orleans’ district rank fell from 36th to 37th out of 69 parishes.
  • The percent of students scoring 20 or higher on the ACT (a requirement for TOPS 4-year scholarships) fell from 38% to 35%. The state average remained flat at 45%.
  • The percent of students scoring Excellent or Good on End of Course Tests (EOCs), fell from 61% to 58%. The state average remained flat at 62%.

The good news:

  • New Orleans outperformed most other high-poverty districts (more than 75% economically disadvantaged students) on both the ACT and EOCs. Looking at the percent of seniors scoring 18 or higher on the ACT, only three high-poverty districts performed better than New Orleans – St. Bernard, Jefferson and Catahoula. Looking at the percent scoring Excellent or Good on the EOCs, only 2 high-poverty districts performed better – St. Bernard and Jefferson.
  • Black students in New Orleans outperformed the national and state averages for black students, with a local ACT Composite score of 17.8, compared to 17.1 nationally1 and 17.4 for the state.

Continue reading

More students graduating on time!

New Orleans 4-year Cohort Graduation Rate Continues to Rise

The citywide 4-year graduation rate for New Orleans (OPSB+RSD) increased by 2.5 percentage points, bringing it to 75.2% of all students graduating on time.
 
Today, the state released the 4-year cohort graduation rates for the Class of 2015. The Class of 2015 cohort includes all students who entered 9th grade for the first time in 2011, and the cohort graduation rate is the percentage of students in the cohort who graduated within four years. 

New Orleans Outperforms the State in Every Key Sub-Group

In 2015, 73.3% of African-American students graduated on time in New Orleans, an increase of 2.6 percentage points from 2014 and 1.9 points higher than the state average of 71.4% for African-American students. 
 
The New Orleans 4-year cohort graduation rates for other key sub-groups – students with disabilities, economically disadvantaged students, and English language learners – were also higher than the state average for these sub-groups.

Continue reading

By the Numbers: 2015 TOPS Scholarships

New Orleans high schools rocked it!

TOPS data for the class of 2015 shows 10% more high school graduates were eligible for TOPS college scholarships last year, and New Orleans is rapidly closing the gap with the state.

Gains in TOPS Eligibility

In five years, New Orleans closed the gap to the state average to a mere three points! 

Since 2010, the percentage of public high school graduates eligible for TOPS two-year or four-year scholarships increased 18 points, from 29% to 47%. The state increased 9 points, from 41% to 50%.

Eligible for TOPS
2010
2014
2015
5-year
gains
New Orleans
29%
37%
47%
+ 18 pts
Louisiana
41%
45%
50%
+ 9 pts

Gains in Eligibility for TOPS 4-year Scholarships

Since 2010, the percentage of public high school graduates eligible for 4-year TOPS scholarships increased 15 points, from 19% to 34%. The state increased 7 points, from 31% to 38%.

Continue reading

K-8 School Performance Scores Released

The state has released the 2015 School Performance Scores (SPS) and School Letter Grades for elementary schools, middle schools, and combination schools (high schools with a K-8 grade). These scores are based on the more rigorous standards and PARCC test for grades 3-8 in English and math and represent a new baseline score for schools.

So … How did we do?

  • Even with harder tests and tougher academic standards, New Orleans kept pace with the state and is performing well when compared to other high poverty districts in the state.
  • More students are attending A, B, or C graded schools and fewer attend D or F schools.
  • Many elementary and middle schools across the state struggled with the new standards, and schools in New Orleans were no exception. More than half of the city’s elementary and middle schools saw a decrease in their SPS, and more than 20% went down at least one letter grade.

New Orleans Kept Pace with the State

The District Performance Score is the most comprehensive measurement of school and student performance. It includes all students (including students that attended schools now closed), all tests, and all grades. The DPS for New Orleans includes all RSD and OPSB schools, both charter and direct-run. It does not include Type 2 charters.

  • The District Performance Score for New Orleans remained the same as last year – 83.4, a high C just 1.6 points from a B. Louisiana’s statewide score decreased from 89.2 to 88.8, remaining a B.

View 2015 District Performance Scores (xlsx).

Continue reading