By the Numbers: The Graduating Class of 2014

The state just released new data on cohort graduation rates and college enrollment rates. Continuing our By the Numbers series, Educate Now! takes a look at the class of 2014.

THE GOOD NEWS

100% more students enrolled in college

In 2005, only 675 Orleans Parish Public School graduates enrolled in a two or four year college the following fall, compared to 1,360 graduates from New Orleans’ class of 2014.

Even though the 2014 senior class was much smaller than the 2005 senior class (2,654 students versus 3,753), our schools sent a much higher proportion of students to college. This tremendous increase is a testament to the hard work of educators in New Orleans.
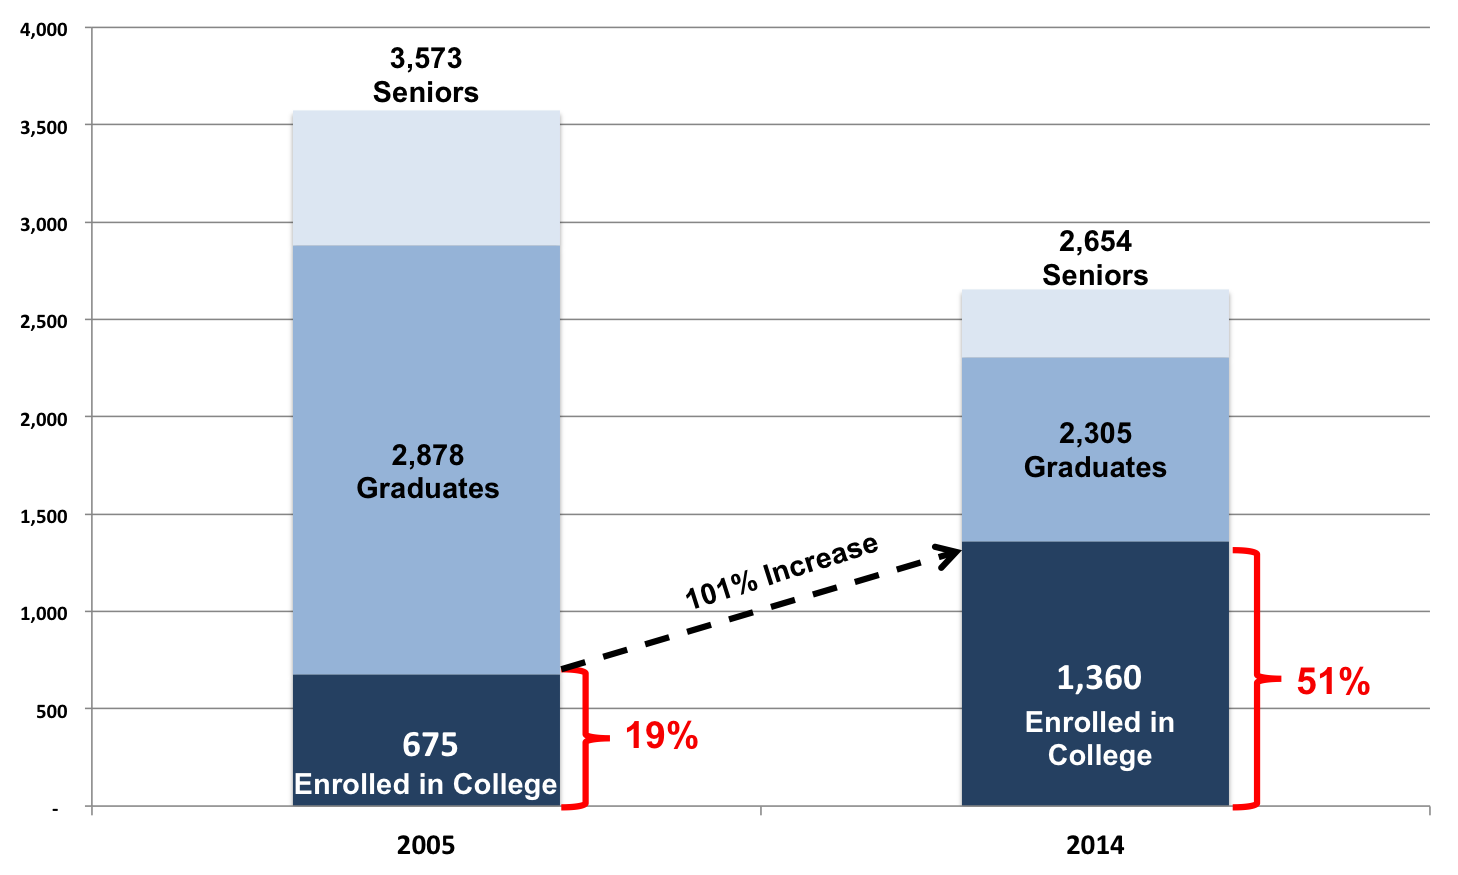
College_Enrollment_2005_vs_2014

 2005 vs. 2014

2005 2014
Number of seniors
3573 2654
Number of graduates
2878 2305
Number enrolled in college
675 1360
Percent of senior class in college
19% 51%

65% of Black males graduated on time: New Orleans outperforms nation

With a 65% Black male graduation rate1, New Orleans is now outperforming the state and the nation. The Schott Foundation recently published Black Lives Matter: The Schott 50 State Report on Public Education and Black Males. In 2013:
  • The national graduation rate for Black males was 59%.
  • Louisiana’s graduation rate for Black males was 59%.
  • New Orleans graduation rate for Black males was 65%.

Continue reading

By the Numbers: High School Performance 2005 vs. 2014

p The state just released the 2014 ACT scores for public schools. Continuing our By the Numbers series, Educate Now! takes a look at high school performance.

ACT Performance

New Orleans has seen strong gains since 2005.

The growth in ACT scores comes even as the percentage of seniors taking the test has increased significantly. (The state now requires students to take the ACT as part of high school accountability; in 2005, students were not required to take the ACT.) Since 2005, as the percentage of seniors taking the ACT increased, New Orleans improved its composite score1 from 17 to 18.4, while the state declined from 19.8 to 19.2. Both RSD and OPSB have seen gains in their ACT scores2.

  • During this time (2005 to 2014), the RSD improved its ACT average by 2 points, more than any other district in the state. It is one of only 5 districts that improved more than 1 point during this time.
  • OPSB improved by 0.8 points.
ACT Scores Over Time
  Class of 2005 Class of 2014 Change
OPSB
19.7 20.5 0.8
Schools transferred to RSD
14.4 16.4 2
New Orleans (OPSB + RSD)
17 18.4 1.4
Louisiana
19.8 19.2 – 0.6


If comparing performance, RSD schools serve a very different population than OPSB, with more African American students, more poor students, and more students with special needs. Some OPSB high schools have selective admissions, and only three of seven OPSB high schools participate in EnrollNOLA (OneApp). RSD data includes the alternative high schools in the city, and every RSD high school is open-admissions and participates in EnrollNOLA.

Continue reading

Charter Schools Help Improve Special Education in New Orleans

This guest editorial appeared in the Times-Picayune, and I wanted to share it with you.

Charter Schools Help Improve Special Education in New Orleans: Leslie Jacobs

In fourth grade, James, a special needs student at John Dibert Charter School, was struggling academically and behaviorally. He was making daily trips to the dean’s office for disruptive behavior and emotional outbursts. James is now on honor roll in eighth grade, scored mastery and advanced on state tests and is applying to Ben Franklin High School.

Zaria transferred to Arthur Ashe Charter School at the beginning of second grade as a special education student, reading at kindergarten level. By the end of fourth grade she scored mastery in English.

Zaria and James are two of the many students who have benefited from the city’s improvement in serving students with special needs.

Continue reading

New Orleans Schools: Then and Now

In honor of the 9 year anniversary of Katrina, Danielle Dreilinger compiled a snapshot of New Orleans schools then and now.

For those of you who were here before Katrina, it may bring back some interesting memories. For those of you who have moved here since the storm, thanks for being part of the recovery of the city and of our schools.

You can see how far we have come in 9 years … and how far we still have to go.

New Orleans public schools pre-Katrina and now, by the numbers


High School Performance

The state has released data on high school performance.

The Really Good News

New Orleans showed robust growth on the End of Course Tests (EOCs).

  • New Orleans1 (OPSB & RSD) is 8th in improvement in the state, with 59% of students proficient (scoring Excellent or Good) compared to 52% in 2013.
  • This is a jump of 7 percentage points; the state improved 3 points, from 59% to 62% proficient.
  • Compared to the other 69 districts, New Orleans is now #37, up from #47 last year (up 11 spots).
  • When we look at all New Orleans2, including Type 2 charters and NOCCA, 61% of students are proficient, just 1 point below the state average.

The state has been phasing in the EOCs by testing more subjects each year. This year, for the first time, all six subjects were tested: Algebra, Biology, English II, English III, Geometry and U.S. History. Since 2011, New Orleans has improved 14 points, while the state has improved 7 points.

Percent of Students (OPSB & RSD) Proficient
2012-2014_EOC_Percent_Proficient_NO_v_State-2

See below for EOC performance by school.

The Really Good News (part 2)

New Orleans students improved on the ACT

All students are now required to take the ACT. Many take it multiple times, and ACT uses their highest score.

  • Looking at all New Orleans high schools, 50% of students scored an 18 or higher, up 6 points from 44% in 2013.
  • Statewide, 59% of Louisiana students scored an 18 or higher, a 1 point gain from 2013.
  • 18 is the score that ACT says is aligned with college success.

Continue reading

Grades 3-8 Test Scores Are In

New Orleans Flat; State Flat

The Louisiana Department of Education (LDE) has released the 2014 test scores for grades 3-8. The percent of students performing Basic or above remained unchanged from 2013. This is the first year since Katrina that New Orleans did not improve.

  • The state average remained the same at 69% Basic or above.
  • New Orleans (RSD & OPSB) remained the same at 63% Basic or above.
  • OPSB went down 2 points; RSD remained the same; and Type 2 charters grew 5 points.

Percent Basic or Above – Grades 3-8

District 2013 2014 Change
Louisiana
69% 69% 0
All New Orleans
63% 63% 0
RSD – N.O.
57% 57% 0
OPSB
84% 82% -2
Type 2 charters – N.O.
73% 78% 5

Continue reading

Who’s Going to College

Who’s Going to College? A new report from the Louisiana Department of Education shows how many students from the class of 2012 enrolled in college after high school. For the Class of 2012 (OPSB & RSD combined):

  • 58% of graduates enrolled in college right after high school.
  • By the fall of 2013, college enrollment went up 10 points to 68% of graduates.
  • This is 2 points higher than the state average of 66%.

Continue reading

Do as I said … Not as I say: Common Core and PARCC

Word on the street is that the Governor is supporting efforts to stop the use of PARCC tests next year, and he might even show up at the House Education Committee to testify.

PARCC, which stands for the Partnership for Assessment Readiness for College and Careers, has worked for 4 years with states, school districts, principals, and teachers to develop tests aligned to the Common Core State Standards. If Louisiana abandons the PARCC tests now, it will cost the state millions of dollars and many years to develop an inferior test that would not allow us to compare the performance of our schools and students to the rest of the nation.

The Facts

— Louisiana adopted the Common Core Standards in 2010, with the Governor’s support.
— The PARCC tests were developed according to the agreement the Governor signed in June 2010, expressly recognizing the states were developing the test and that is was not a federal test.
— PARCC was developed by a consortium of 19 states and the District of Columbia. It is not a federal, one-size-fits-all test. The Governor would never have agreed to a “federal test” in 2010.

Funny … the Governor has a long record of supporting Common Core and PARCC tests.

November 2009: In a press release touting Louisiana’s decision to apply for Race to the Top Funding, which included signing on to the Common Core State Standards, the Governor got it right, saying:

“Our children have only one chance to grow and get the skills they need to succeed. We must take advantage of every opportunity we have to strengthen our education system and provide more opportunities for Louisiana children.”

Continue reading

Revisionist History

High School Performance: Then and Now
Or … Leslie’s Rant

A few months ago, I went on WBOK radio to discuss public schools in New Orleans. A number of callers, as well as one of the hosts, disputed the fact that our schools are getting better. I readily acknowledge that we have room for improvement, but quite frankly, I am tired of the revisionist history some folks insist on using to rationalize their opposition to the school reforms taking place in New Orleans.

There cannot be honest disagreement, based on any semblance of facts, on whether schools are doing a better job educating students today versus 2005 – THEY ARE SIGNIFICANTLY BETTER.

To make my point, let’s look at the TOPS data, which is compiled by the Office of Student Financial Assistance (not the Department of Education). Louisiana offers qualifying students a scholarship to a 4-year (TOPS Opportunity1) or 2-year (TOPS Tech) college based on a combination of GPA, coursework, and ACT scores. OSFA has been compiling this data since TOPS began, and the standard for earning a scholarship is the same in 2013 as it was in 2005, so it’s a pretty good measurement to compare high school performance.

So let’s compare.

New Orleans has made remarkable gains since 2005. 

In 2013, 38% of our graduates qualified for TOPS scholarships, an increase of more than 50% from the 2005 rate of 25%.

TOPS Eligibility

Year
# Graduates
TOPS
4-year
TOPS
2-year
All TOPS
2005
2906
16%
9%
25%
2013
2252
26%
12%
38%

View LOSFA’s 2013 TOPS report.

But this isn’t the real story.

Critics of the current reforms say they don’t like that schools are run by two governing bodies – RSD/BESE and OPSB. They want to go back to just one system.

They forget that in 2005 New Orleans also had two school systems: a system of “good” schools and one of “bad” schools – separate and very unequal.

These two unequal systems are vividly captured in the 2005 TOPS data. Continue reading

Positive Results from New Expulsion Policies

The Recovery School District (RSD) and the Orleans Parish School Board (OPSB) announced the results of the first year of the new expulsion policy for public schools in Orleans Parish.

  • There were 272 expulsions in the 2012-13 school year, for an expulsion rate of .57%
  • In comparison, the state had an expulsion rate of .7%
  • New Orleans’ expulsion rate is 20% below the state

Not only is New Orleans leading the state in academic gains, we are doing so while expelling fewer students than the state average.

What did New Orleans do differently in the 2012-13 school year?

  • Common expulsion process and definition: Charter and traditional school leaders across the RSD, OPSB, and Type 2 charter schools worked together to establish a joint policy and coordinate a centralized process for student expulsions.

The 2012-13 school year was the inaugural year, with 90 of the 91 public schools in New Orleans participating. These schools agreed that all expulsion hearings would be administered by the RSD’s Student Hearing Office and agreed to limit the reasons a student could be expelled. Continue reading