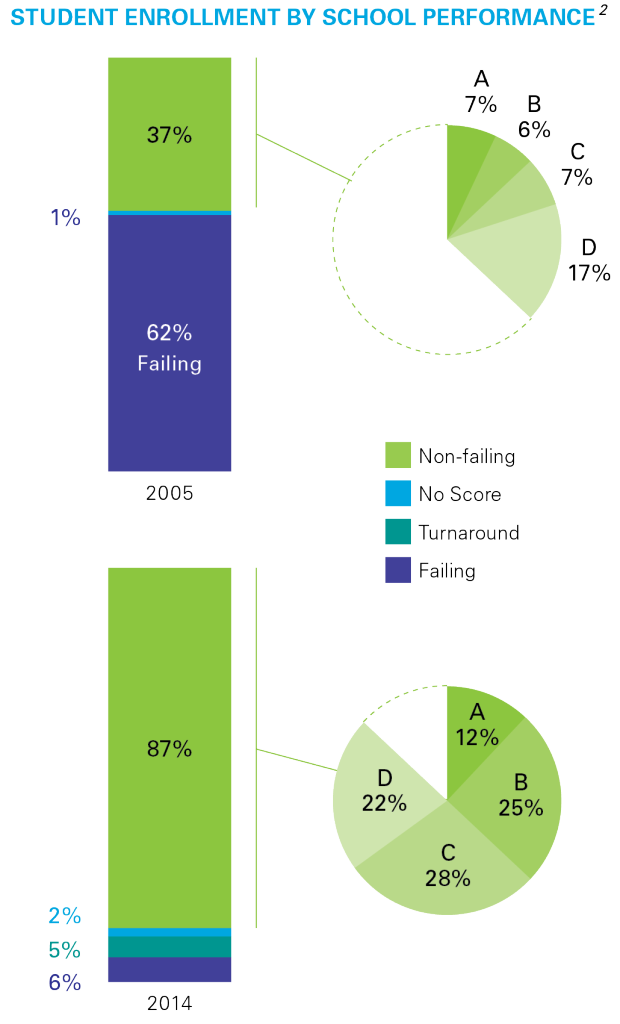
This fall, Louisiana’s Department of Education will release new baseline scores for schools and for student performance. As we move to the new academic standards, Educate Now! will no longer use 2005 as a comparison point. Instead, our new baseline will be the 2014-15 school year.
It’s time to focus on what’s next for New Orleans public schools, but before we move on, Educate Now! wants to thank the educators, administrators and volunteers who have worked tirelessly over the past decade to help our students succeed.
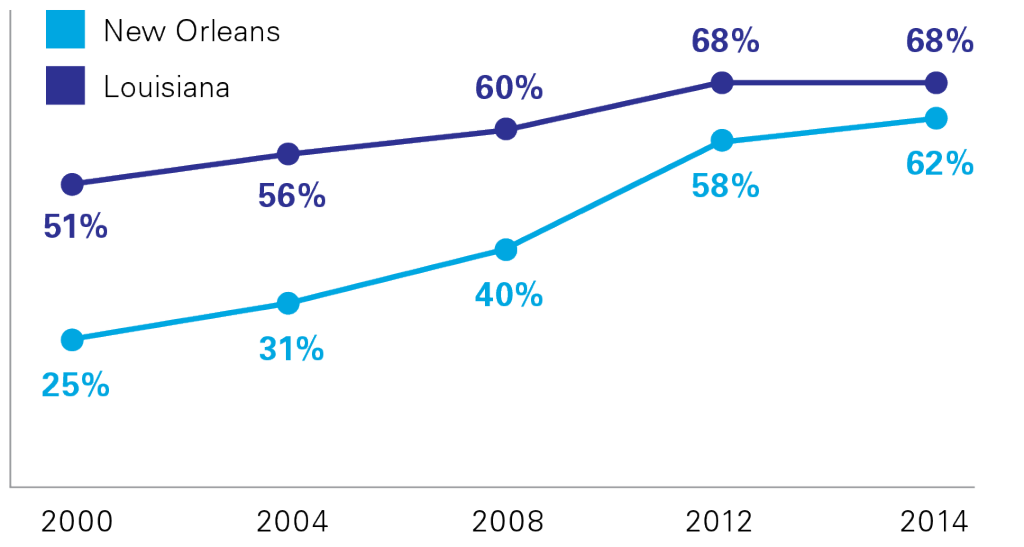
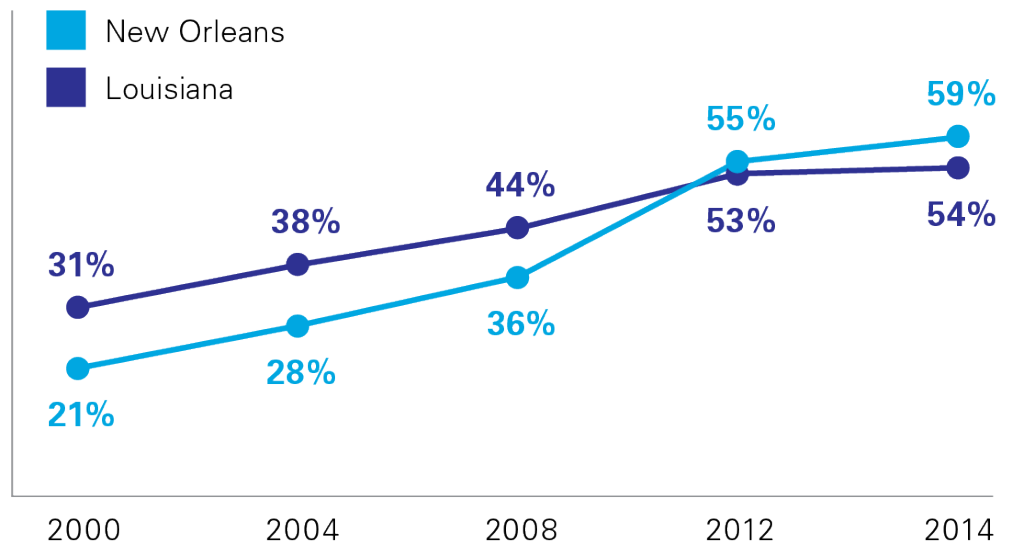
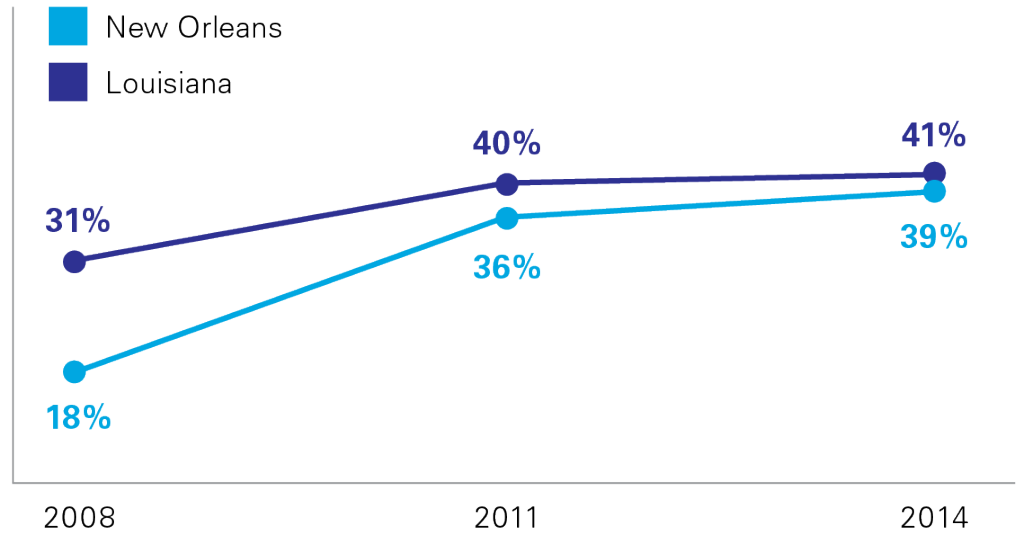
Ten years after Katrina, here’s how New Orleans public schools have changed.
SCHOOL AND STUDENT PERFORMANCE
STUDENTS WITH DISABILITIES2
GRADUATES
| The on-time graduation rate increased 19 percentage points.
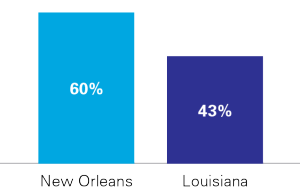
More graduates are enrolling in college.3
More graduates are eligible for TOPS merit scholarships.4 |
Black males are graduating at a higher rate than the state and national averages.5 a 2014 Black Male
|
ACT scores improved 1.8 points even as participation rates increased. a  |
To download a pdf version of Educate Now!’s 10-year report, click here.
________________________________
1 Includes OPSB and RSD schools. In 2005, schools were given stars (1 to 5) not letter grades; for the purpose of comparison, 4 and 5 = A, 3 = B, 2 = C, 1 = D, and “Academically Unacceptable = F. T schools are schools in the first or second year of Turnaround.
2 Students with Disabilities includes any student with an Individualized Education Plan (IEP).
3 2004 data includes in-state colleges only, but based on recent data from the National Student Clearinghouse, fewer than 5 percent of New Orleans graduates and 20% of Louisiana graduates attend out-of-state colleges.
4 TOPS provides state-funded 2- and 4-year merit-based scholarships to Louisiana public colleges and universities.
5 National is 2013 from the Schott report http://blackboysreport.org
All data courtesy of the Louisiana Department of Education. For more, see the 10 Years After Katrina page on their website.

