New Orleans Gains Continue!
I am amazed and awed by the continued academic improvement of our schools and students. In 8 years:
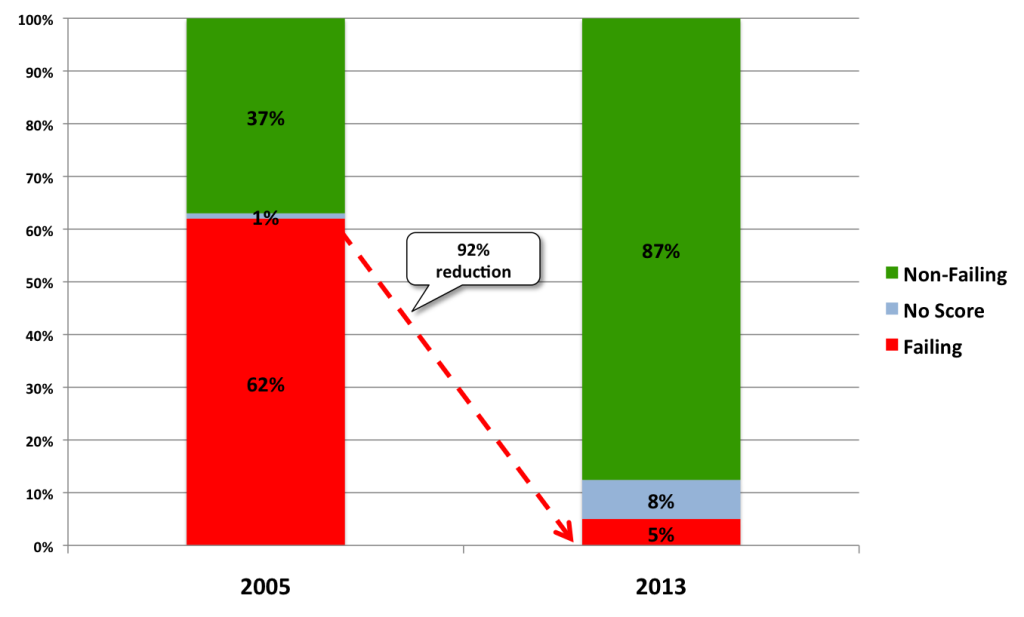
- New Orleans has gone from 62% of students attending failing schools to 5%.
- We have moved up in the state rankings from 67th to 38th.
- We have shown robust improvement on the ACT.
- We have more high performing, high poverty schools than anywhere else in Louisiana.
Congratulations to the remarkable educators across the city. Incredibly well done!
Only 5% of students now attend a failing school –
down from 62% in 2005.
The End of Failing Schools in New Orleans Is In Sight
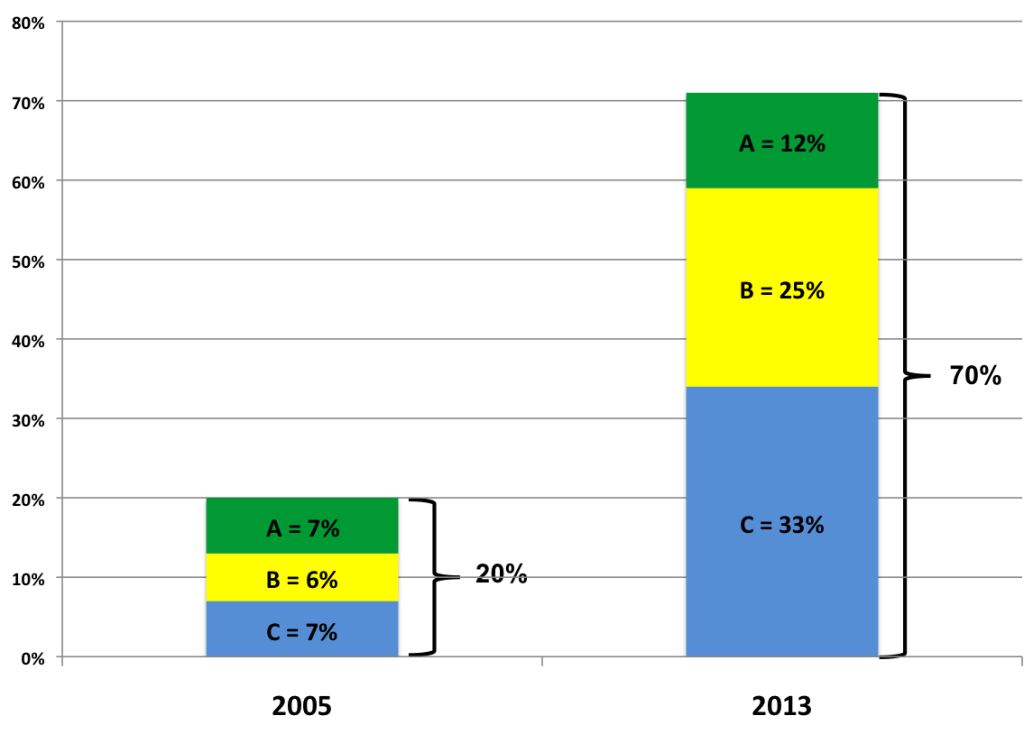
70% of students attend A, B, or C schools – up from 20% in 2005.*
Percent in A, B, or C Schools
2005 vs. 2013

View 2013 School Performance Scores.
New Orleans has moved up in the state rankings from 67th to 38th.
The District Performance Score (DPS) is the most comprehensive measurement of school and student performance. It includes all students, all tests, and all grade levels. The DPS for New Orleans includes all RSD and OPSB schools, both charter and direct-run.
New Orleans has a combined District Performance Score of 83.4 and received a letter grade of C.* We are now just 1.6 points shy of a B, and we are rapidly moving up in the state rankings.
|
New Orleans District Rank Over Time
|
|
|
2005
|
67th out of 68 districts – second to last |
|
2012
|
51st out of 69 districts – in the bottom third |
|
2013
|
38th out of 69 districts – close to the middle |
Both OPSB and RSD deserve congratulations:
- OPSB would be ranked #2 in the state with a DPS of 108.2 and a grade of A.
- RSD-New Orleans is no longer failing! It received a DPS of 71.9 and a grade of C, and it would be ranked 58th out of 69 districts.
We have shown robust improvement on the ACT.
The state also released ACT results. This year, Louisiana became one of 9 states to require all high school graduates take the ACT, and the increased participation caused Louisiana’s score to go down from 20.3 to 19.5.
- The 2013 citywide (RSD + OPSB) composite ACT score is 18.1, compared to the state score of 19.5 and the national average of 20.9.
- OPSB’s composite is 19.7, and RSD’s is 16.3.
Comparing to prior ACT performance
In 2005, the composite ACT score for Orleans Parish was 17.0. Today it is 18.1, so we know we have improved.
This improvement is understated, however, because in 2005 not all juniors and seniors had to take the ACT. What might our real growth be on an “apples to apples” basis? There are two ways to estimate it.
The first way is to use a 2004 statewide equating study from the Louisiana Department of Education that compared performance on the Graduation Exit Exam (GEE) to performance on the ACT. The study showed a strong correlation between how a student scored on the GEE with how they would perform on the ACT.
Using New Orleans’ average performance on the GEE in 2005 (a tad higher than Approaching Basic), we can estimate that New Orleans would have had an ACT score between 16 and 16.5 if all juniors and seniors had been required to take the test.
The second way is to compare New Orleans performance relative to the other districts that were also very low performing in 2005.
|
Comparing ACT Results
|
||
| 2005 DPS Rank | Parish | 2013 ACT Score |
| 68 | St. Helena | 15.6 |
| 67 | New Orleans | 18.1 |
| 66 | Madison | 15.3 |
| 65 | East Feliciana | 16.5 |
| 64 | City of Baker | 16.3 |
The four other parishes average around a 16 ACT, and New Orleans (OPSB + RSD) now outperforms them all with an 18.1 ACT.
New Orleans has likely seen close to a 2 point gain on the ACT since 2005 – a HUGE improvement in a test where nationally scores have not increased since 2005.
We have more high performing, high poverty schools
than anywhere else in Louisiana.
It is incredibly hard work to have high performing schools with very high percentages of poor students. Statewide, there were 341 open-enrollment schools that had 90% or more of their students receiving free or reduced lunch. Only 22 received a letter grade of A or B. Ten of these schools – almost half – are in New Orleans.
They are doing a fabulous job!
| High Performing, High Poverty Schools | 2013 Grade |
% Free or Reduced Lunch |
| Arthur Ashe Charter School |
B
|
96%
|
| Einstein Charter School | B | 93% |
| John Dibert Community School | B | 94% |
| KIPP Central City Academy | B | 98% |
| KIPP McDonogh 15 School for Creative Arts | B | 96% |
| Lagniappe Academy of New Orleans | B | 97% |
| Mahalia Jackson Elementary School | B | 95% |
| Mary Bethune Elementary Literature/Tech | B | 98% |
| Sci Academy | B | 93% |
| Sophie B. Wright Learning Academy | B | 96% |
School Performance Scores – The Details
Here is the breakdown of New Orleans schools by letter grade and SPS score.*
New Orleans Schools
| Grade | SPS Range* |
# of Schools | % of Total Enrollment |
| A | 100-150 | 6 | 12% |
| B | 85-99.9 | 18 | 25% |
| C | 70-84.9 | 25 | 33% |
| D | 50-69.9 | 19 | 17% |
| F | Below 50 | 9 | 5% |
| No SPS | 11 | 8% | |
| TOTAL | 88 |
Congratulations to these 24 high performing A and B schools.
| High Performing Schools |
2013 SPS
|
2013 Grade
|
| Benjamin Franklin High School | 138.5 | A |
| Lusher Charter School | 132.6 | A |
| Lake Forest Elementary Charter School | 125.3 | A |
| Edward Hynes Charter School | 107 | A |
| Audubon Charter School | 106.4 | A |
| International School of Louisiana | 105.3 | A |
| KIPP Central City Academy | 96.9 | B |
| Benjamin Franklin Elem. Math and Science | 96.1 | B |
| Einstein Charter School | 95.4 | B |
| Warren Easton Senior High School | 95.3 | B |
| Alice M. Harte Elementary Charter School | 94.2 | B |
| Eleanor McMain Secondary School | 94.2 | B |
| Edna Karr High School | 93.8 | B |
| Martin Behrman Elementary School | 92.1 | B |
| Arthur Ashe Charter School | 90.2 | B |
| KIPP McDonogh 15 School for the Creative Arts | 89.9 | B |
| Sci Academy | 88.6 | B |
| Sophie B. Wright Learning Academy | 88.5 | B |
| Mahalia Jackson Elementary School | 88.1 | B |
| Mary Bethune Elementary Literature/Technology | 88.1 | B |
| John Dibert Community School | 87.8 | B |
| O. Perry Walker Senior High School | 85.7 | B |
| New Orleans Military/Maritime Academy | 85.2 | B |
| Lagniappe Academy of New Orleans | 85 | B |
School Growth
This year schools earned bonus points if they demonstrated significant academic growth with their lowest performing students – students identified as non-proficient (performing below grade level).
Schools could earn up to 10 bonus points if they made significant progress with their lowest performing students. We know many of our students enter school already behind. These schools are doing a great job helping their students catch up.
31 schools received the maximum of 10 bonus points.
Congratulations to these high growth schools.
| High Growth Schools |
| Arthur Ashe Charter School |
| Batiste Cultural Arts Academy at Live Oak Elem |
| Benjamin Banneker Elementary School |
| Cohen College Prep |
| Crescent Leadership Academy |
| Dwight D. Eisenhower Elementary School |
| Einstein Charter School |
| Eleanor McMain Secondary School |
| Esperanza Charter School |
| Fannie C. Williams Charter School |
| G.W. Carver High School |
| Gentilly Terrace Elementary School |
| Harriet Tubman Charter School |
| John Dibert Community School |
| Joseph A. Craig Charter School |
| KIPP Central City Academy |
| KIPP McDonogh 15 School for the Creative Arts |
| KIPP New Orleans Leadership Academy |
| Lafayette Academy |
| Langston Hughes Charter Academy |
| McDonogh #32 Elementary School |
| McDonogh #35 College Preparatory School |
| McDonogh City Park Academy |
| Miller-McCoy Academy for Mathematics and Business |
| Nelson Elementary School |
| Reed Elementary School |
| Samuel J. Green Charter School |
| Sarah Towles Reed Senior High School |
| SciTech Academy at Laurel Elementary |
| Sophie B. Wright Learning Academy |
| William J. Fischer Elementary School |
2012-13 was a great year!! Congratulations!!
View the 2013 Louisiana SPS Release from the Department of Education and the 2013 RSD SPS Release from the Recovery School District.
Learn how Louisiana calculates SPS and assigns School Grades.
View Reports:
No SPS: This year, there are 11 schools with no SPS. They were either new charters (2), schools that were recently transitioned to charters or given new charter operators (5), or schools that had insufficient testers for an SPS (4).
New SPS Scale: In 2013, Louisiana recalibrated the school grading scale from a 200+ point range to a 150 point range to better align with a typical A through F grading scale. This year represents a new baseline for both SPS and DPS calculations.

