K-8 School Performance Scores Released

The state has released the 2015 School Performance Scores (SPS) and School Letter Grades for elementary schools, middle schools, and combination schools (high schools with a K-8 grade). These scores are based on the more rigorous standards and PARCC test for grades 3-8 in English and math and represent a new baseline score for schools.

So … How did we do?

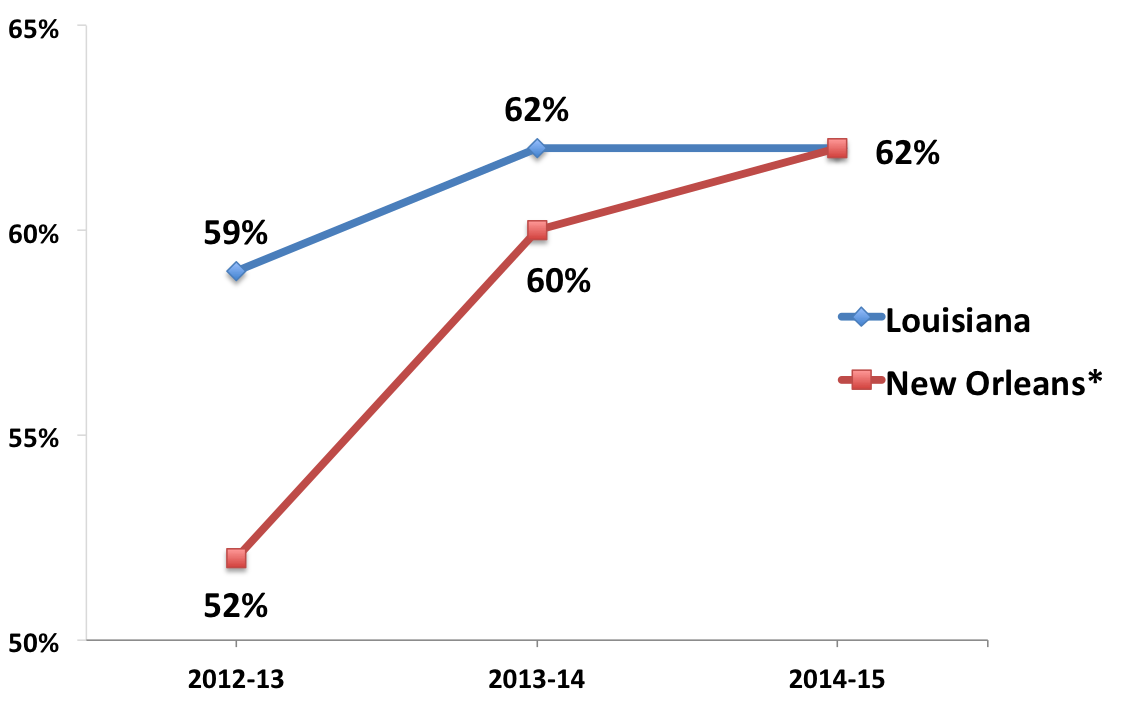
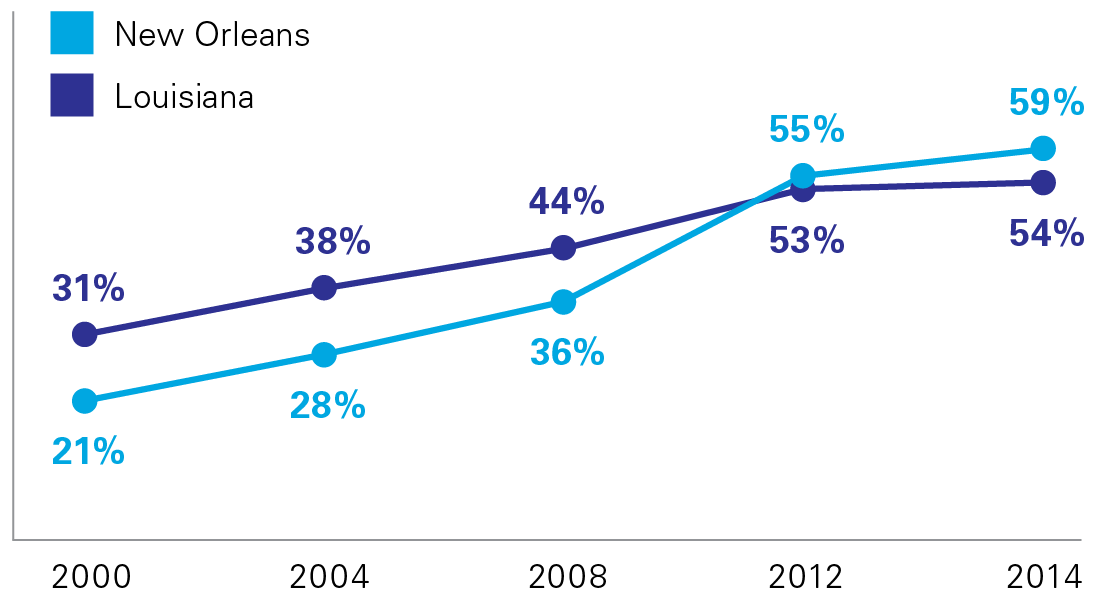
  • Even with harder tests and tougher academic standards, New Orleans kept pace with the state and is performing well when compared to other high poverty districts in the state.
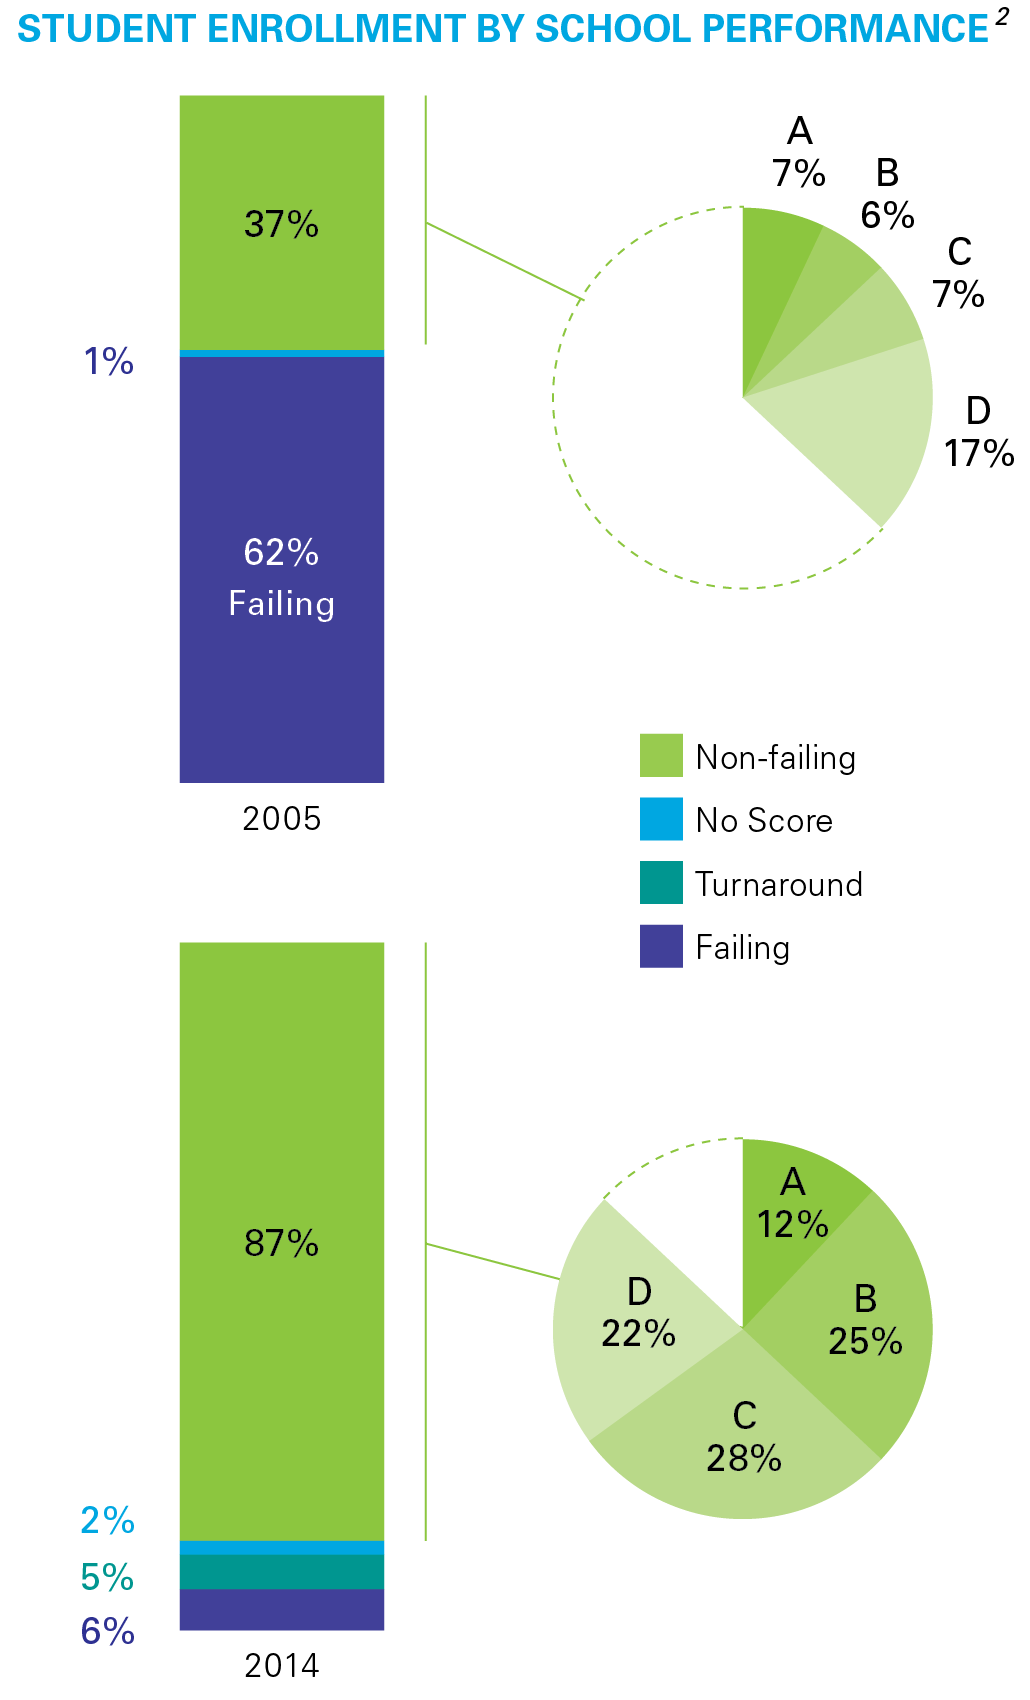
  • More students are attending A, B, or C graded schools and fewer attend D or F schools.
  • Many elementary and middle schools across the state struggled with the new standards, and schools in New Orleans were no exception. More than half of the city’s elementary and middle schools saw a decrease in their SPS, and more than 20% went down at least one letter grade.

New Orleans Kept Pace with the State

The District Performance Score is the most comprehensive measurement of school and student performance. It includes all students (including students that attended schools now closed), all tests, and all grades. The DPS for New Orleans includes all RSD and OPSB schools, both charter and direct-run. It does not include Type 2 charters.

  • The District Performance Score for New Orleans remained the same as last year – 83.4, a high C just 1.6 points from a B. Louisiana’s statewide score decreased from 89.2 to 88.8, remaining a B.

View 2015 District Performance Scores (xlsx).

Continue reading

High School Performance – A WOW Moment!

New Orleans high schools are (finally) showing great improvement.

The state released Letter Grades and School Performance Scores (SPS) for most high schools1, and there is cause for celebration!

Highlights

  • More than half of New Orleans high schools earned a letter grade of A or B. Five years ago, only two high schools had an A or B letter grades and both were selective admission schools (Ben Franklin and Lusher).
  • New Orleans schools outperform other high-poverty high schools in Louisiana. Among schools statewide serving student populations where three-quarters or more of students are economically disadvantaged, New Orleans has the top 5 performing schools.
School
2015 Grade
SPS
Edna Karr A 111.1
Warren Easton A 109.2
Sci High B 98.6
KIPP Renaissance B 96.8
Sci Academy B 96.3
  • Four high schools were among the top 10 most improved in the state: KIPP Renaissance, Clark Prep, New Orleans Military and Maritime Academy, and Sci Academy.
  • Eight high schools improved enough to change their letter grade.

Continue reading

PARCC Results: A New Baseline

The state has released the 2014-15 PARCC test results for English and math, grades 3-8.

How did New Orleans do?

  • 60% of students scored Proficient (Basic or above); the state was 65%.
  • 28% of students scored Mastery or above; the state was 33%.

Compared to other districts?

  • New Orleans is ranked 45th out of 69 districts for percent Mastery or above.
  • We outperformed 21 districts, and tied with three others.
  • We held steady. Last year we ranked 46th; this year we ranked 45th.

Continue reading

2015 EOC Results – New Orleans ties the state!

 
New Orleans high school performance on End-of-Course tests (EOCs) continues to improve.
  • New Orleans citywide, including Type 2 charters, is now performing at the state average.
  • New Orleans is the 5th most improved district in the state.
  • OPSB and RSD-NO combined is in the top 50% statewide and is ranked of #31 out of 69 parishes. This is the first academic ranking where New Orleans is in the top half of the state!
Percent Proficient on EOCs
EOCs_2013_to_2015_NO_vs_State
* Includes all New Orleans Schools – OPSB, RSD-NO, and two Type 2 charters.

Continue reading

Thank A Teacher!

Thank_a_Teacher_Bumper_Sticker

It’s true! New Orleans has seen dramatic improvements in student performance over the last ten years. These gains wouldn’t have been possible without the hard work and tireless dedication of our teachers.
 
Show your support for New Orleans teachers by sharing this email with your friends or uploading this Thank You message to Facebook or Twitter.
 
You can also order a free Thank A Teacher bumper sticker from Educate Now! Just reply to this email, and be sure to include your mailing address so we know where to send it.*
 
Public schools in New Orleans are #1 for academic improvement in the state. Thank a teacher today!

By the Numbers: Student and School Performance

This fall, Louisiana’s Department of Education will release new baseline scores for schools and for student performance. As we move to the new academic standards, Educate Now! will no longer use 2005 as a comparison point. Instead, our new baseline will be the 2014-15 school year.

It’s time to focus on what’s next for New Orleans public schools, but before we move on, Educate Now! wants to thank the educators, administrators and volunteers who have worked tirelessly over the past decade to help our students succeed.

Ten years after Katrina, here’s how New Orleans public schools have changed.

SCHOOL AND STUDENT PERFORMANCE

The percentage of students enrolled in failing schools fell from 62% to 6%. The percentage enrolled in A or B schools increased from 13% to 37%.1
en-enrollment-by-performance-072715
The percentage of students proficient on state tests increased from 25% to 62%.
aen-performance-all-students-072715 no header
The percentage of Black students proficient on state tests increased from 21% to 59%, and we now outperform the state by 5 percentage points.
aperformance-black-students


Continue reading