This fall, Louisiana’s Department of Education will release new baseline scores for schools and for student performance. As we move to the new academic standards, Educate Now! will no longer use 2005 as a comparison point. Instead, our new baseline will be the 2014-15 school year.
It’s time to focus on what’s next for New Orleans public schools, but before we move on, Educate Now! wants to thank the educators, administrators and volunteers who have worked tirelessly over the past decade to help our students succeed.
Ten years after Katrina, here’s how New Orleans public schools have changed.
SCHOOL AND STUDENT PERFORMANCE
The percentage of students enrolled in failing schools fell from 62% to 6%. The percentage enrolled in A or B schools increased from 13% to 37%.1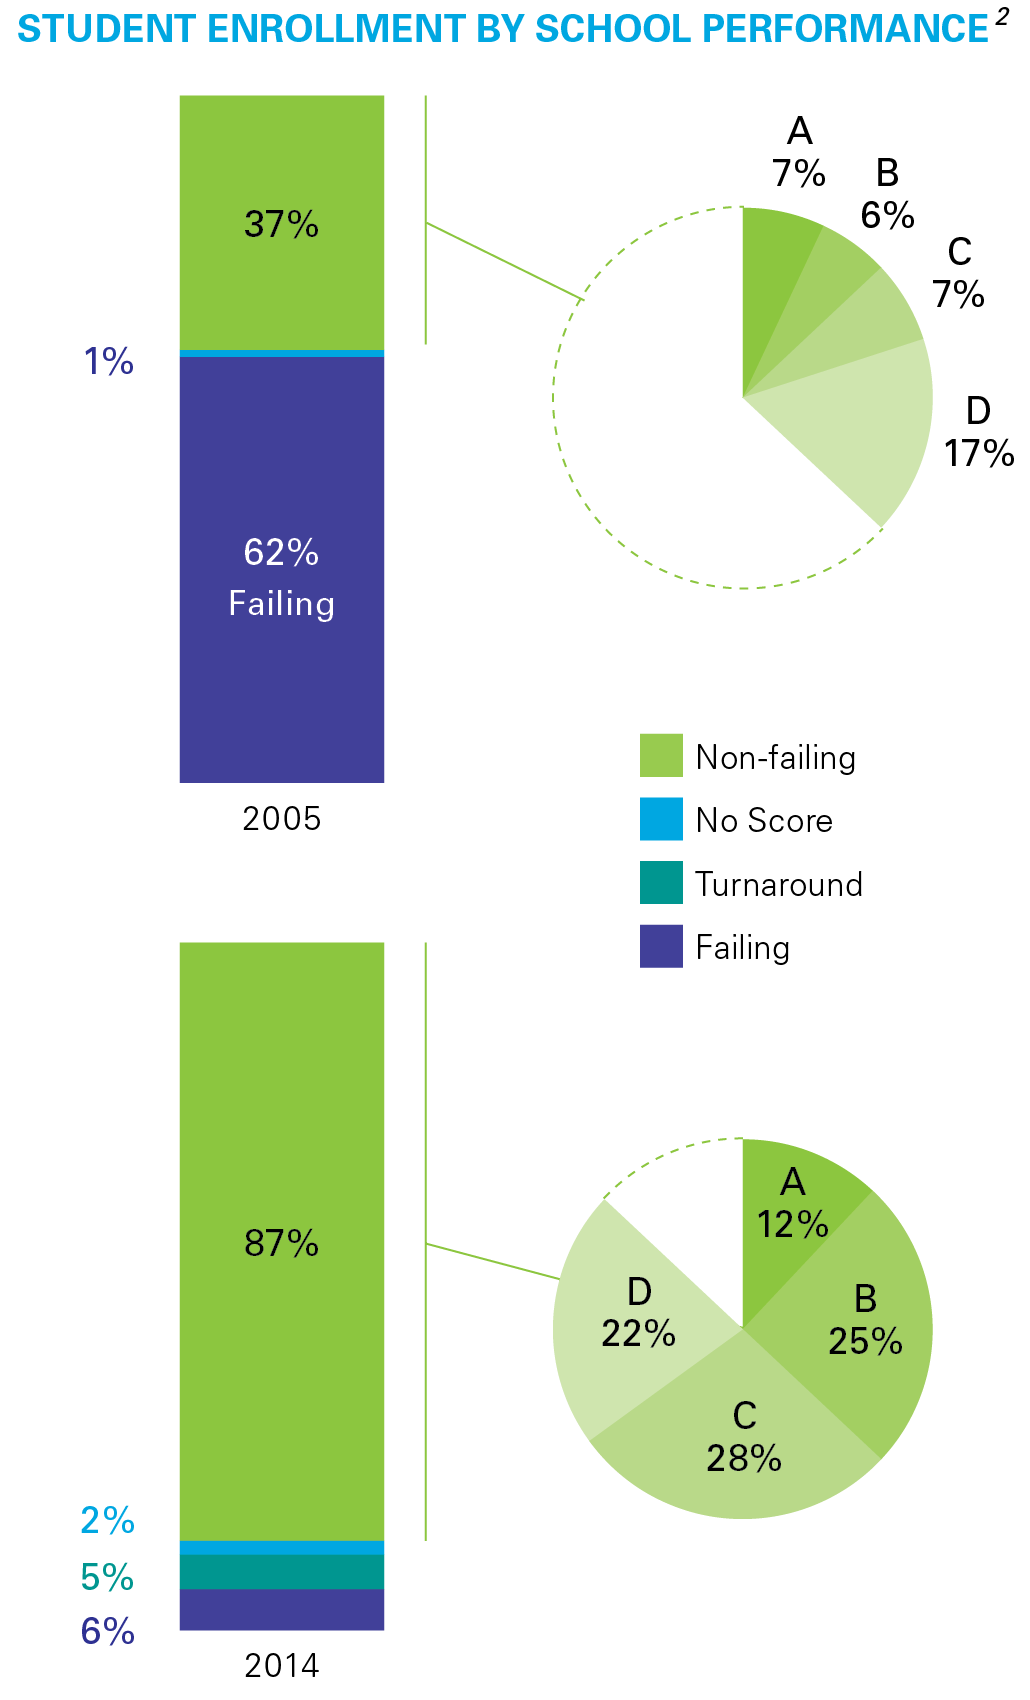 |
The percentage of students proficient on state tests increased from 25% to 62%. a  |
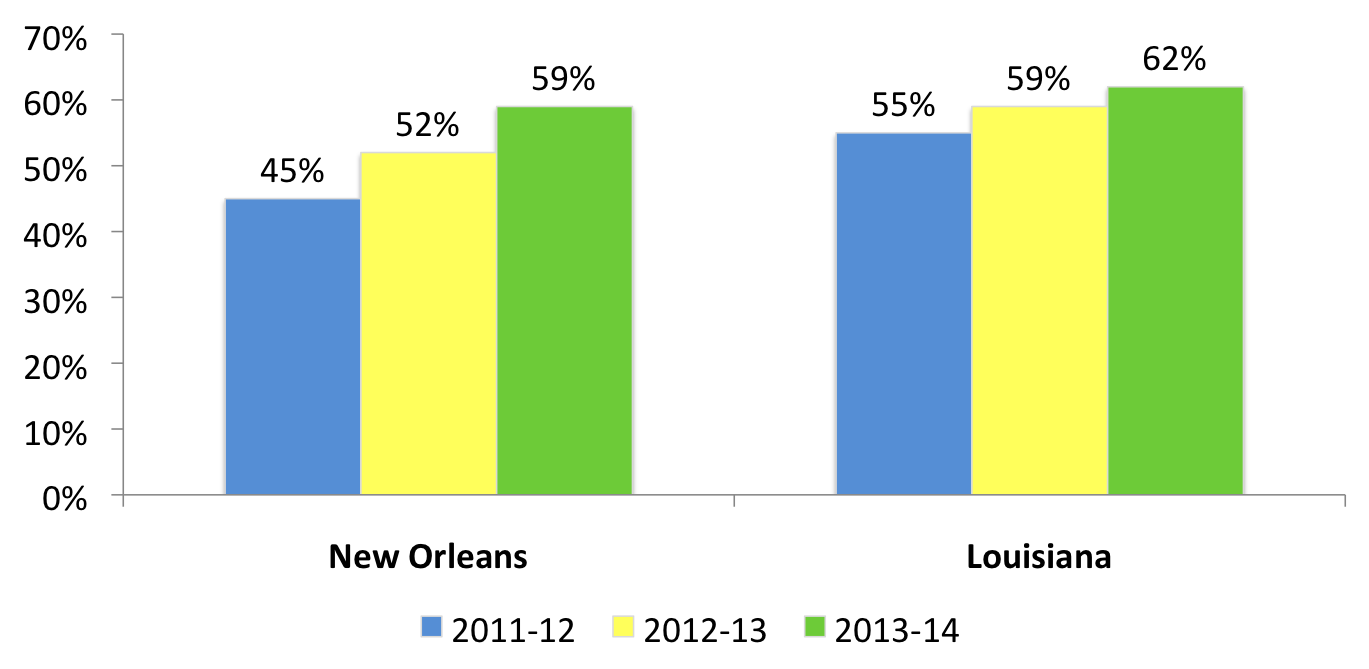
| The percentage of Black students proficient on state tests increased from 21% to 59%, and we now outperform the state by 5 percentage points. a 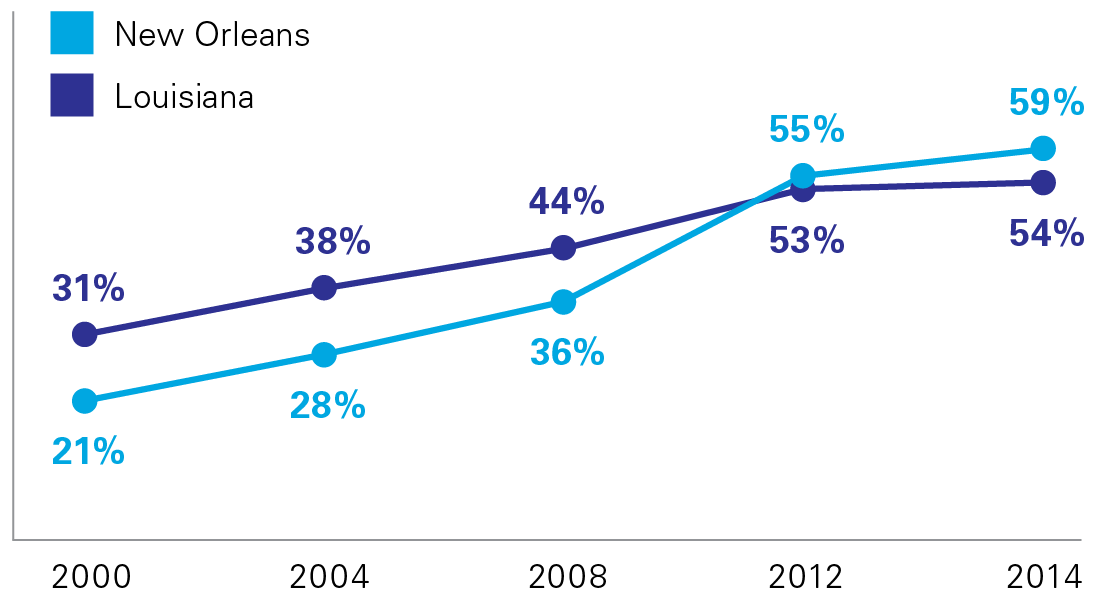 |