x
The state has released the results for the 2015-16 LEAP tests for grades 3-8. This is the second year of new tests aligned to more rigorous standards.
How Did New Orleans Do?
- New Orleans student performance improved, but lagged the state.
- New Orleans outperformed the state average for African-American students and English Language Learners.
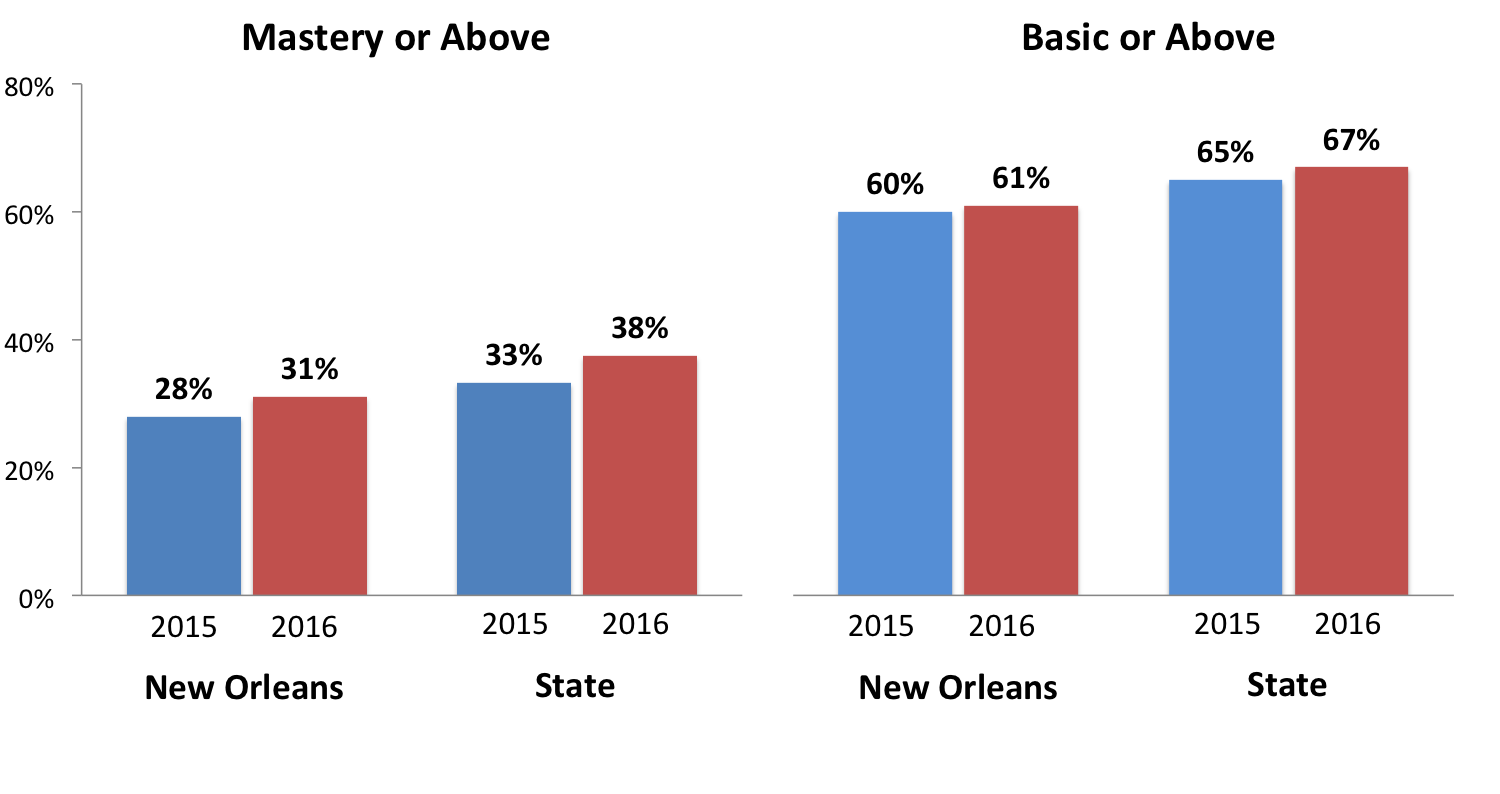
Performance: All Students
- The percentage of New Orleans students reaching the state’s new proficiency goal of Mastery or above grew from 28% to 31%, a gain of 3 points; the state improved by 5 points.
- The percentage of New Orleans students performing Basic or above grew from 60% to 61%, a gain of 1 point; the state improved by 2 points.
Gains in LEAP Performance in English and Math
These results are for English and math only. To view all subjects, view the state’s 2016 Tests by District Report.
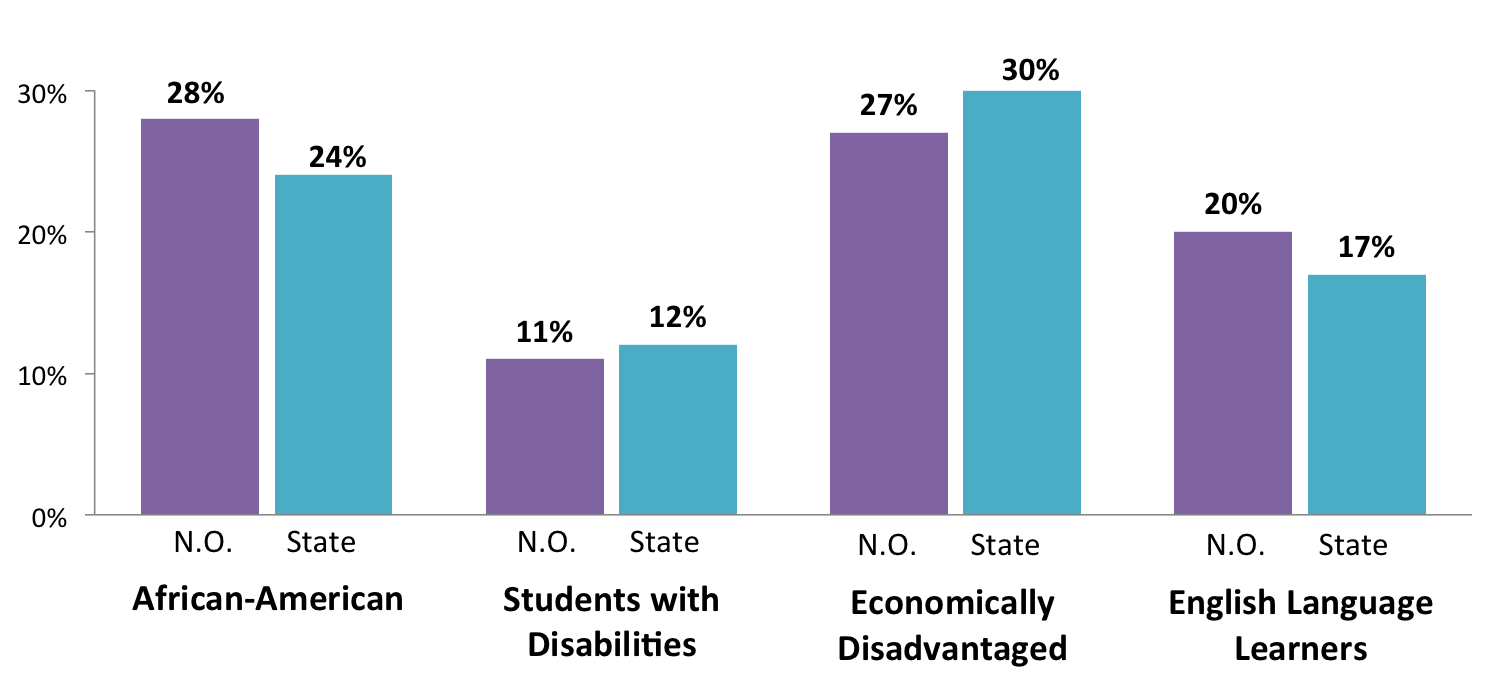
Sub-Group Performance
- New Orleans African-American students outperformed the state average by 4 percentage points, and our English Language Learners outperformed the state by 3 points.
- Students with disabilities trailed the state by 1 percentage point, and our economically disadvantaged students trailed the state by 3 points.
Mastery or Above in English or Math by Sub-Group
District Performance
The state began transitioning to the higher standards in 2014. Since then, New Orleans’ performance in relationship to other districts has remained relatively stable.
- This year, we rank 47th out of 69 districts for the percent Mastery or above, outperforming 22 districts.
- In 2015, we ranked 45th, but tied with 3 other districts, outperforming 21.
- In 2014, we ranked 46th, but tied with 1 other district, outperforming 22.
Transition to Mastery and Higher Standards – Back to LEAP
Louisiana began transitioning to new, more rigorous expectations for students in 2014. Originally, the state adopted the Common Core State Standards, and last year students took the PARCC test. PARCC tests were designed by a collaboration of states (including Louisiana) to be aligned with national NAEP tests and allow for multi-state comparisons.
We then proceeded to have the Common Core War, with the Superintendent and BESE fighting the Governor and others opposed to these standards. Happily, a truce was declared last year.
As part of the Common Core compromise, Louisiana went back to a revised LEAP test, aligned to the higher standards. Up to 49% of the questions on these new LEAP tests can come from PARCC or another national test to allow for multi-state comparisons.
The LEAP tests have five performance levels: Unsatisfactory, Approaching Basic, Basic, Mastery and Advanced. From 1999-2014, Louisiana’s proficiency goal for students was to perform at the Basic or above level.
Beginning last year, Louisiana adopted the more rigorous proficiency goal of Mastery. Students performing at the Mastery level should be college or career ready when they graduate from high school, i.e., prepared to take credit-bearing courses at two- or four-year colleges or to enter the workforce with the needed literacy, numeracy, and critical thinking skills.
How Did Our Schools Perform?
This chart shows school performance on the LEAP tests for English and math only; it does not include science and social studies. To view all subjects, view the state’s 2016 Tests by School Report.
LEAP Results by School for English and Math
|
School Name
|
Mastery or Above | Basic or Above | ||
| 2016 | 2015 | 2016 | 2015 | |
|
Lusher Charter School
|
88% | 88% | 98% | 98% |
|
Lake Forest Elementary Charter School
|
85% | 79% | 98% | 97% |
|
Audubon Charter School
|
60% | 59% | 86% | 90% |
|
Edward Hynes Charter School
|
59% | 53% | 89% | 86% |
|
Alice M. Harte Elementary Charter School
|
52% | 48% | 82% | 81% |
|
Benjamin Franklin Elem. Math And Science
|
42% | 41% | 77% | 73% |
|
Robert Russa Moton Charter School
|
41% | 40% | 77% | 78% |
|
Mary Bethune Elementary Literature/Techn
|
41% | 46% | 76% | 80% |
|
Kipp Central City Academy
|
40% | 28% | 74% | 69% |
|
Mahalia Jackson Elementary School
|
40% | 37% | 68% | 61% |
|
Louisiana Statewide
|
38% | 33% | 67% | 65% |
|
Esperanza Charter School
|
35% | 22% | 67% | 55% |
|
Morris Jeff Community School
|
35% | 36% | 71% | 70% |
|
Lafayette Academy
|
34% | 37% | 67% | 70% |
|
Kipp Central City Primary
|
33% | 36% | 69% | 72% |
|
Kipp Believe College Prep
|
32% | 24% | 65% | 56% |
|
Encore Academy
|
32% | 21% | 58% | 56% |
|
Mary D. Coghill Charter School
|
32% | 36% | 64% | 66% |
|
Harriet Tubman Charter School
|
31% | 24% | 62% | 63% |
|
New Orleans (OPSB + RSD)
|
31% | 28% | 61% | 60% |
|
Martin Behrman Charter Acad Of Creative
|
31% | 32% | 63% | 67% |
|
Phillis Wheatley Community School
|
30% | 24% | 58% | 52% |
|
Arthur Ashe Charter School
|
30% | 26% | 66% | 65% |
|
Renew Scitech Academy At Laurel
|
29% | 34% | 64% | 73% |
|
Einstein Charter School
|
28% | 32% | 57% | 64% |
|
Success Preparatory Academy
|
26% | 21% | 60% | 53% |
|
Renew Cultural Arts Academy At Live Oak
|
26% | 21% | 57% | 51% |
|
Renew Dolores T. Aaron Elementary
|
26% | 22% | 59% | 57% |
|
Akili Academy Of New Orleans
|
26% | 23% | 56% | 59% |
|
Samuel J. Green Charter School
|
26% | 25% | 65% | 59% |
|
Pierre A. Capdau Learning Academy
|
24% | 17% | 56% | 50% |
|
Kipp Mcdonogh 15 School For The Creative
|
24% | 21% | 58% | 56% |
|
Eleanor Mcmain Secondary School
|
23% | 20% | 54% | 53% |
|
Renew Schaumburg Elementary
|
23% | 21% | 54% | 55% |
|
Edgar P. Harney Spirit Of Excellence Aca
|
23% | 27% | 55% | 65% |
|
Wilson Charter School
|
22% | 10% | 55% | 36% |
|
Homer A. Plessy Community School
|
22% | 19% | 42% | 40% |
|
Langston Hughes Charter Academy
|
22% | 20% | 53% | 53% |
|
James M. Singleton Charter School
|
21% | 12% | 52% | 41% |
|
Mildred Osborne Charter School
|
21% | 15% | 49% | 45% |
|
Kipp New Orleans Leadership Academy
|
21% | 16% | 53% | 50% |
|
Sylvanie Williams College Prep
|
21% | 20% | 51% | 46% |
|
Dr. Martin Luther King Charter School Fo
|
21% | 23% | 58% | 68% |
|
Mcdonogh #35 Academy
|
20% | 9% | 51% | 43% |
|
Joseph A. Craig Charter School
|
19% | 15% | 43% | 43% |
|
Lawrence D. Crocker College Prep
|
19% | 19% | 50% | 54% |
|
Fannie C. Williams Charter School
|
18% | 15% | 52% | 51% |
|
Dwight D. Eisenhower Academy Of Global S
|
18% | 23% | 49% | 57% |
|
Paul Habans Charter School
|
17% | 10% | 46% | 35% |
|
Gentilly Terrace Elementary School
|
16% | 11% | 48% | 42% |
|
Renew Mcdonogh City Park Academy
|
16% | 13% | 46% | 40% |
|
Sophie B. Wright Institute Of Academic E
|
16% | 13% | 46% | 41% |
|
Arise Academy
|
15% | 14% | 38% | 40% |
|
Cohen College Prep
|
15% | 18% | 43% | 49% |
|
Nelson Elementary School
|
14% | 11% | 40% | 36% |
|
Mcdonogh #32 Literacy Charter School
|
12% | 10% | 38% | 41% |
|
Mcdonogh 42 Charter School
|
11% | 12% | 38% | 45% |
|
William J. Fischer Accelerated Academy
|
9% | 8% | 27% | 34% |
|
Crescent Leadership Academy
|
7% | 0% | 16% | 6% |
Shout Outs!
These schools improved more than the state average in both the percent of students scoring Mastery or above and the percent scoring Basic or above.
|
School
|
Gain in Mastery or Above
|
Gain in
Basic or Above
|
|
Louisiana Statewide
|
5 pts
|
2 pts
|
|
Crescent Leadership Academy
|
7 pts | 10 pts |
|
Edward Hynes Charter School
|
6 pts | 3 pts |
|
Esperanza Charter School
|
13 pts | 12 pts |
|
James M. Singleton Charter School
|
9 pts | 11 pts |
|
Kipp Believe College Prep
|
8 pts | 9 pts |
|
Kipp Central City Academy
|
12 pts | 5 pts |
|
Mcdonogh #35 Academy
|
11 pts | 8 pts |
|
Mildred Osborne Charter School
|
6 pts | 4 pts |
|
Paul Habans Charter School
|
7 pts | 11 pts |
|
Phillis Wheatley Community School
|
6 pts | 6 pts |
|
Pierre A. Capdau Learning Academy
|
7 pts | 6 pts |
|
Wilson Charter School
|
12 pts | 19 pts |
For more information:
LDOE press release on 2016 LEAP results
OPSB and RSD-New Orleans press release on 2016 LEAP results
LDOE 2016 LEAP Assessment Presentation
2016 LEAP State and District Achievement Level Summary
2016 LEAP State, District, School Achievement Level Summary
2016 Mastery and Above District Percentile Rankings