The state has released data on high school performance.
The Really Good News
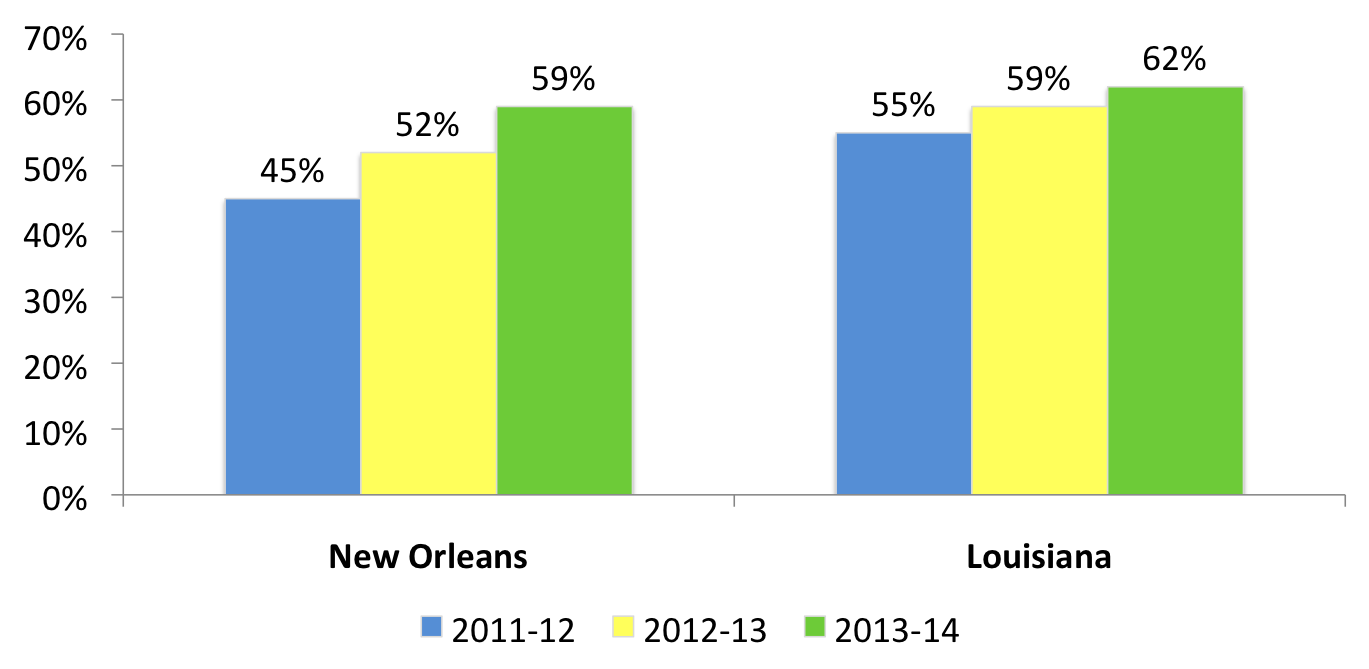
New Orleans showed robust growth on the End of Course Tests (EOCs).
- New Orleans1 (OPSB & RSD) is 8th in improvement in the state, with 59% of students proficient (scoring Excellent or Good) compared to 52% in 2013.
- This is a jump of 7 percentage points; the state improved 3 points, from 59% to 62% proficient.
- Compared to the other 69 districts, New Orleans is now #37, up from #47 last year (up 11 spots).
- When we look at all New Orleans2, including Type 2 charters and NOCCA, 61% of students are proficient, just 1 point below the state average.
The state has been phasing in the EOCs by testing more subjects each year. This year, for the first time, all six subjects were tested: Algebra, Biology, English II, English III, Geometry and U.S. History. Since 2011, New Orleans has improved 14 points, while the state has improved 7 points.
Percent of Students (OPSB & RSD) Proficient
See below for EOC performance by school.
The Really Good News (part 2)
New Orleans students improved on the ACT
All students are now required to take the ACT. Many take it multiple times, and ACT uses their highest score.
- Looking at all New Orleans high schools, 50% of students scored an 18 or higher, up 6 points from 44% in 2013.
- Statewide, 59% of Louisiana students scored an 18 or higher, a 1 point gain from 2013.
- 18 is the score that ACT says is aligned with college success.
The average ACT score for each school has not yet been calculated (that information will be released in August), but below is the percent of seniors who scored a 17 or above (qualifier for TOPS Tech) and 20 or above (qualifier for TOPS Opportunity).
The table below reports ACT results by school using the highest score a 12th grader received.
Performance by School
EOC and ACT Performance (sorted by % proficient on EOCs)
| 2014 Test Results | End of Course | ACT (Grade 12 Only) |
||
| All New Orleans High Schools | % Proficient (Excellent or Good) | % Scoring 17 or higher |
% Scoring 20 or higher |
|
|
Benjamin Franklin High School
|
100% | 100% | 100% | |
|
Lusher Charter School
|
96% | 99% | 96% | |
|
New Orleans Center for Creative Arts (NOCCA)
|
92% | |||
|
New Orleans Military/Maritime Academy
|
85% | NR | NR | |
|
Warren Easton Senior High School
|
73% | 70% | 30% | |
|
Sci Academy
|
72% | 69% | 32% | |
|
OPSB Average
|
71% | 74% | 48% | |
|
Landry-Walker
|
70% | 58% | 39% | |
|
Edna Karr High School
|
68% | 73% | 35% | |
|
International High School of New Orleans
|
67% | 67% | 51% | |
|
G. W. Carver Preparatory Academy
|
66% | |||
|
New Orleans Charter Science and Math HS
|
63% | 65% | 37% | |
|
G. W. Carver Collegiate Academy
|
62% | |||
|
Louisiana Average
|
62% | 67% | 43% | |
|
Cohen College Prep
|
60% | 73% | 23% | |
|
New Orleans Average (OPSB & RSD)
|
59% | |||
|
KIPP Renaissance High School
|
58% | 53% | 21% | |
|
Dr. Martin Luther King Charter School
|
50% | 25% | 8.0% | |
|
Eleanor McMain Secondary School
|
49% | 77% | 43% | |
|
RSD-New Orleans Average
|
47% | 38% | 19% | |
|
McDonogh #35 College Preparatory School
|
43% | 45% | 13% | |
|
Lake Area New Tech Early College HS
|
41% | 43% | 12% | |
|
Sophie B. Wright Learning Academy
|
38% | 50% | 12% | |
|
Algiers Technology Academy
|
34% | 26% | 5% | |
|
Joseph S. Clark Preparatory High School
|
31% | 8% | 2% | |
|
The NET Charter High School
|
17% | 4% | 0% | |
|
Miller-McCoy Academy for Mathematics and
|
16% | 23% | 9% | |
|
Crescent Leadership Academy
|
7% | 14% | 0% | |
|
ReNEW Accelerated High School City Park
|
NR | 5% | 0% | |
|
ReNEW Accelerated High School West Bank
|
NR | 18% | 9% | |
* Does not include K-8 schools or high schools that have closed. ReNEW schools did not have enough EOC testing data in 2014 for public reporting.
View the state’s data on EOC and ACT results for New Orleans high schools (xlsx).
The Bad News
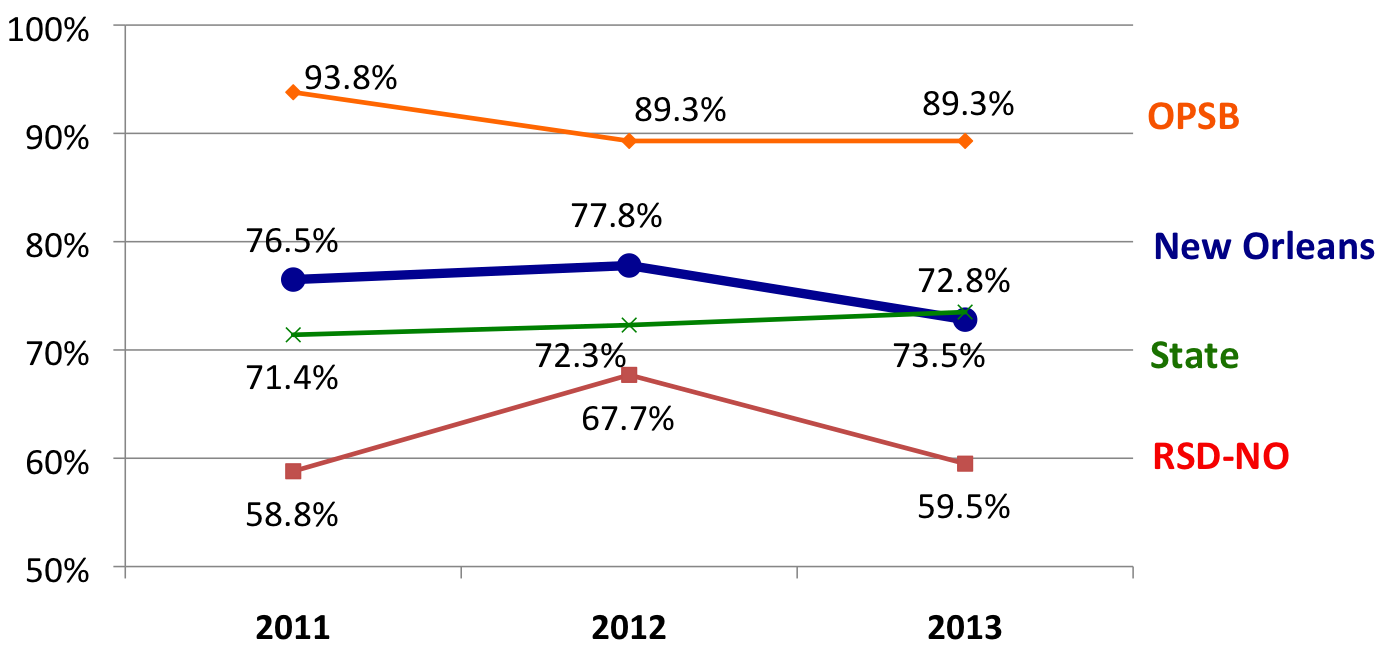
The 4-year cohort graduation rate for New Orleans (OPSB & RSD) fell 5 points, from 78% in 2012 to 73% in 2013. (Cohort results for 2014 will not be available until 2015.)
- This decline equates to 140 fewer students graduating on time.
- The drop came from the RSD, which fell 8 points, from 68% to 60%.
- The Louisiana average rose 1 point from 72% to 73%.
The 4-year cohort graduation rate is the percent of students who graduate on time (in 4 years or less). If a student graduates in 5 years or obtains a GED, they are considered a non-graduate in this calculation.
The RSD believes3 that certain decisions made in the placement of students in 2008 had the impact of overstating its 2012 cohort graduation rate and understating its 2013 rate, and averaging the two years would be a more accurate gauge. It is disappointing that the city fell from 78% to 73% of students graduating on time, but Educate Now! hopes the RSD is correct and next year we will see this rate rebound.
Cohort Graduation Rates
Notes:
1 For high school reporting, New Orleans refers to OPSB and RSD combined.
2 All New Orleans includes includes three additional high schools located in New Orleans, which make up 7% of high school enrollment. They also enroll students from other parishes. International High School (Type 2 charter) New Orleans Military Academy (Type 2 charter) NOCCA (State school).
3 To learn more about the RSD’s performance, read this high school report from the RSD.
Other Resources:
DOE Release on Cohort Graduation Rates
Cohort Graduation Rates by District 2006-2013
State Data on EOC and ACT Results for New Orleans Schools