Student performance showed robust improvement for the 6th consecutive year.
- New Orleans (OPSB & RSD) is #1 in growth, gaining 5 points in the percentage of students meeting the state proficiency goal of Basic or above.
- This growth was fueled by RSD-New Orleans, with its 6 point gain.
- OPSB grew 1 point, equal to the state average.
- Students improved across all grades and subjects.
- New Orleans continues to close the gap with the state average.
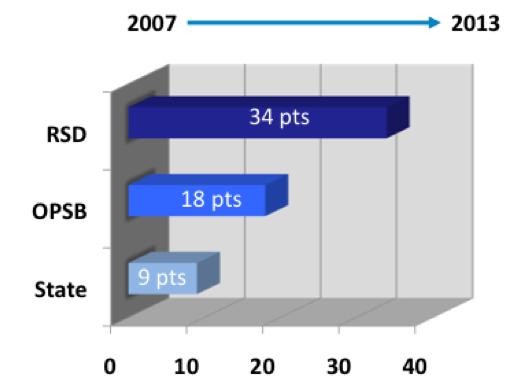
We’re #1 in the State in Growth
Student performance in New Orleans schools (OPSB & RSD) continues to improve faster than any other district in the state. These gains are driven by the Recovery School District, which improved 6 percentage points this year and an astounding 34 points since 2007 – the best in the state.
Grades 3-8
2013 Growth in Percent Scoring Basic or Above
| Schools | 2012 | 2013 | Growth from 2012 |
| RSD-N.O. | 51% | 57% | 6 points |
| All New Orleans | 58% | 63% | 5 points |
| OPSB | 83% | 84% | 1 point |
| Louisiana | 68% | 69% | 1 point |
While OPSB has only grown at the state average the past three years (2010-2013), since 2007 it has improved 18 points while the state grew 9 points.
Growth in Percent Scoring Basic or Above*
* 2000-2011 includes grades 3-11 LEAP, iLeap, and GEE. 2012-2013 includes only grades 3-8 LEAP and iLeap because the GEE has been phased out and replaced by End of Course Tests and the ACT.
More Students Are Meeting Louisiana’s
Proficiency Goal of Basic or Above
Louisiana’s goal is for all students to perform Basic or above in all subjects. Basic is considered “grade level” performance and roughly equates to an ACT score of 19 or higher.
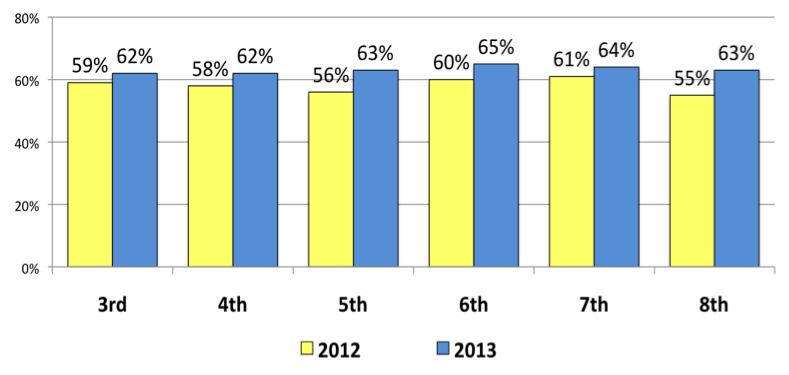
This year, student performance improved across all subjects and all grades.
Grades 3-8
Percent Scoring Basic or Above by Subject
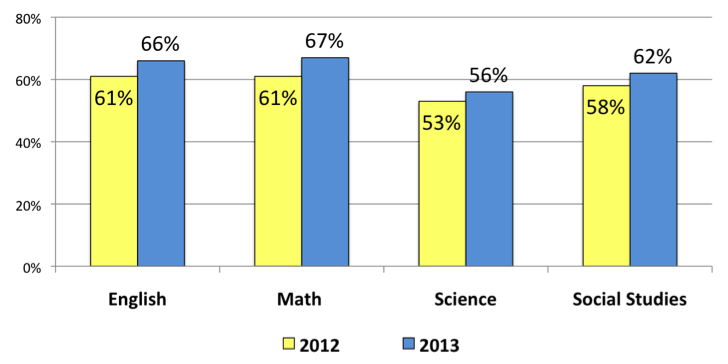
Grades 3-8
Percent Scoring Basic or Above by Grade
We’re Closing the Gap with the State Average
Student performance in New Orleans is improving at a much faster rate than in the rest of the state.
- In 2000, New Orleans trailed the state average by 26 percentage points.
- In 2005, New Orleans trailed the state average by 23 percentage points.
- In 2007, New Orleans trailed the state average by 23 percentage points
- Today, the gap has been reduced to just 6 points.
2000 to 2013
Percent Scoring Basic or Above*
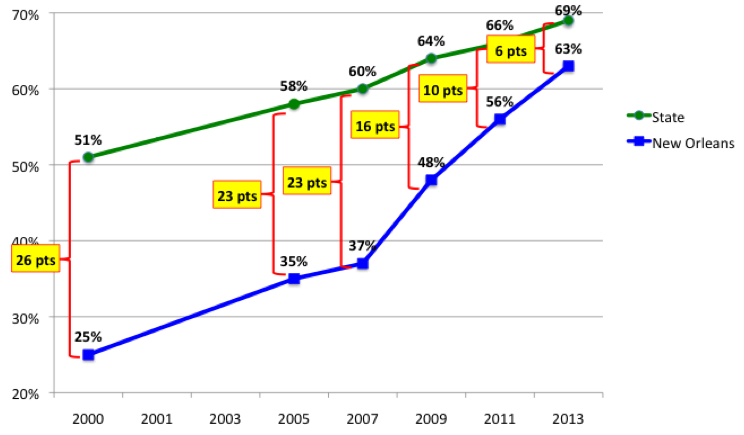
* 2000-2011 includes grades 3-11 LEAP, iLeap, and GEE. 2012-2013 includes only grades 3-8 LEAP and iLeap because the GEE has been phased out and replaced by End of Course Tests and the ACT.
Moving up in the Ranks
As we continue to improve, New Orleans is passing other school districts and moving up in the ranks. Treating New Orleans (OPSB & RSD) as one school district, New Orleans has jumped 20 spots since 2007, going from 65th to 45th in six years.
District Rank
All New Orleans Schools Combined
| Year | % Basic or Above |
District Rank |
| 2007 | 37% | 65 out of 68 |
| 2009 | 48% | 66 out of 69 |
| 2011 | 56% | 59 out of 69 |
| 2013 | 63% | 45 out of 69 |
NOTES
High Schools
The high school data has not yet been released by the Department of Education. This year, high school students take End of Course tests and the ACT for state testing purposes. The Graduate Exit Exam is no longer given.
Test Security (for the skeptics out there)
The Louisiana Department of Education and the Recovery School District have implemented test security protocols that minimize the opportunity for widespread cheating. A recent report from the Legislative Auditor said the LDOE had “sufficient processes to ensure testing data was reliable.” The state conducts erasure analysis (wrong to right) and use of word analysis (multiple students using the same phrases) every year. Additionally, the RSD no longer delivers tests to school sites 7 days in advance. Schools must go to the RSD to pick up the tests a couple of days before a particular test is administered. Finally, the Department of Education has independent test monitors entering schools at unannounced times during testing.
Conclusion
We still have work to do – Roughly one in three students are not yet performing on grade level. But let’s take a moment to celebrate and appreciate these results. This rate of growth for 6 consecutive years is truly an accomplishment. Educate Now! congratulates the teachers, administrators, and students for a great year.
Over the past three years, the gains the city is making relative to the state have been powered by the RSD schools. Since 2010, OPSB has only improved 4 percentage points, the same as the state average, while RSD has grown 14 points. To maintain momentum, OPSB must join RSD in improving faster than the state average. Educate Now! hopes that next year we will be able to applaud both OPSB and RSD for growing faster than the state.
View the Louisiana Department of Education’s release on the 2013 data.
View the RSD-New Orleans release on the 2013 data.
View a comparison of District performance from 2012-2013.
View a comparison of District performance by growth from 2007-2013.